


BLOG
Finance. Data. Decisions.
Actionable insights for business leaders.
From industry-specific KPIs & financial analysis
to data visualization & automation,
we share practical knowledge that drives better business decisions.
Written by: USCPA × MBA × Microsoft Certified Power BI Data Analyst
Financial Insights
-
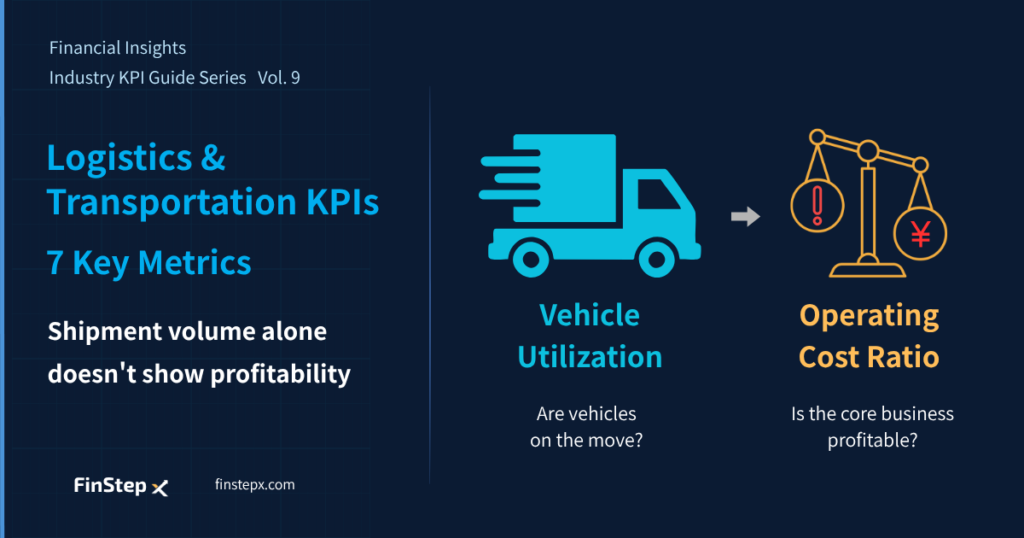
Logistics & Transportation KPIs: 7 Key Metrics, Starting with Vehicle Utilization and Operating Cost Ratio
-
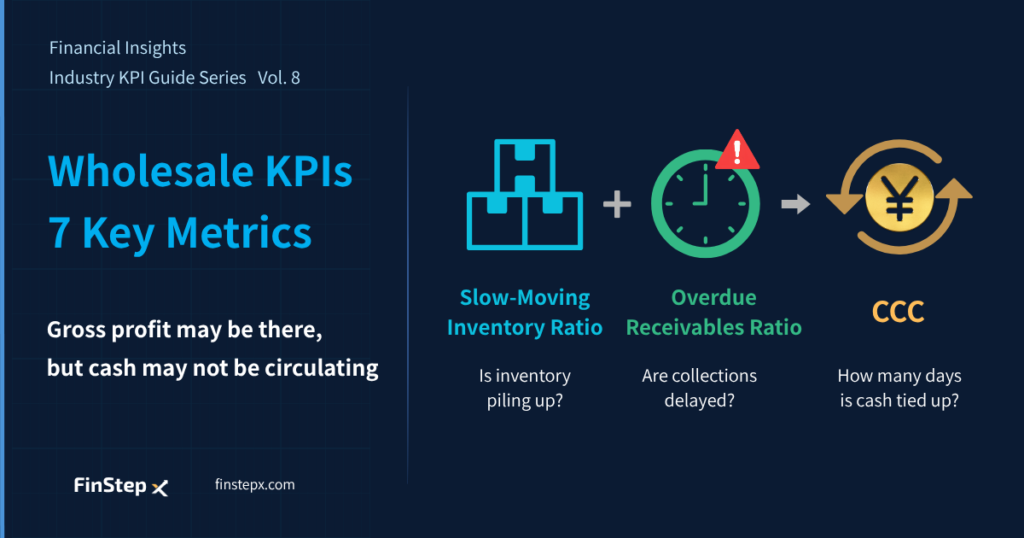
Wholesale KPIs: 7 Key Metrics, Starting with Slow-Moving Inventory, Overdue Receivables, and CCC
-
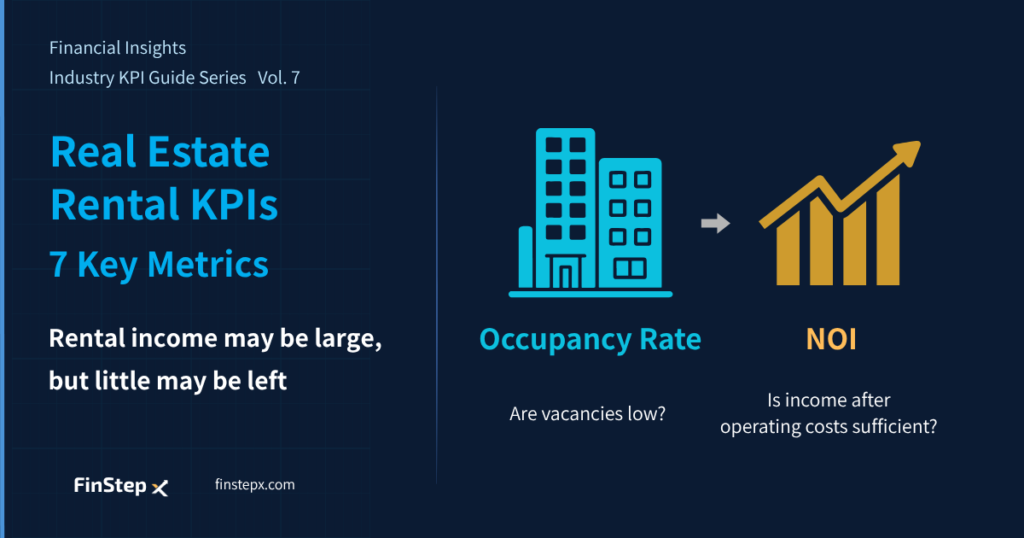
Real Estate Rental KPIs: 7 Key Metrics, Starting with Occupancy Rate and NOI
-
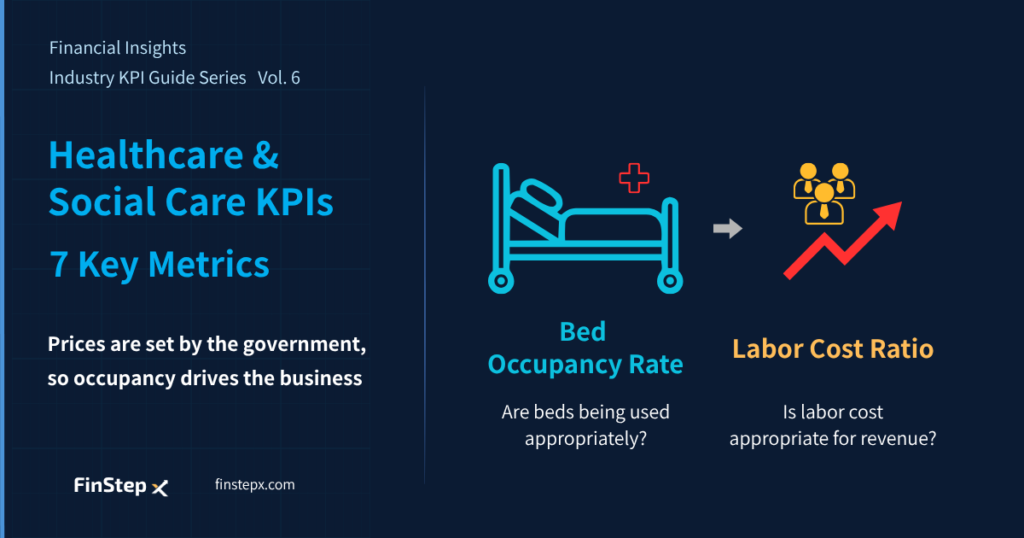
Healthcare and Social Care KPIs: 7 Key Metrics, Starting with Bed Occupancy Rate and Labor Cost Ratio
-
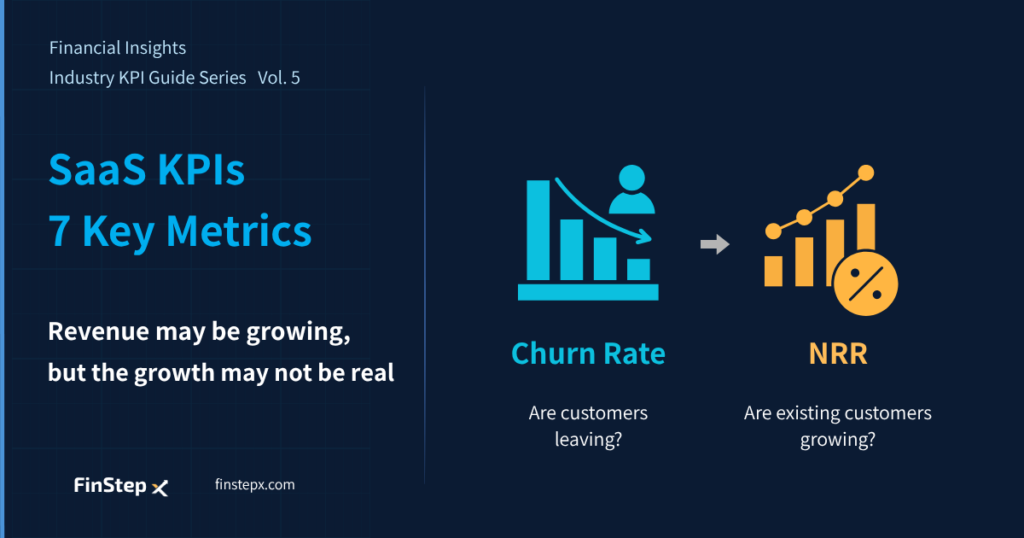
SaaS KPIs: 7 Key Metrics, Starting with Churn Rate and NRR
-
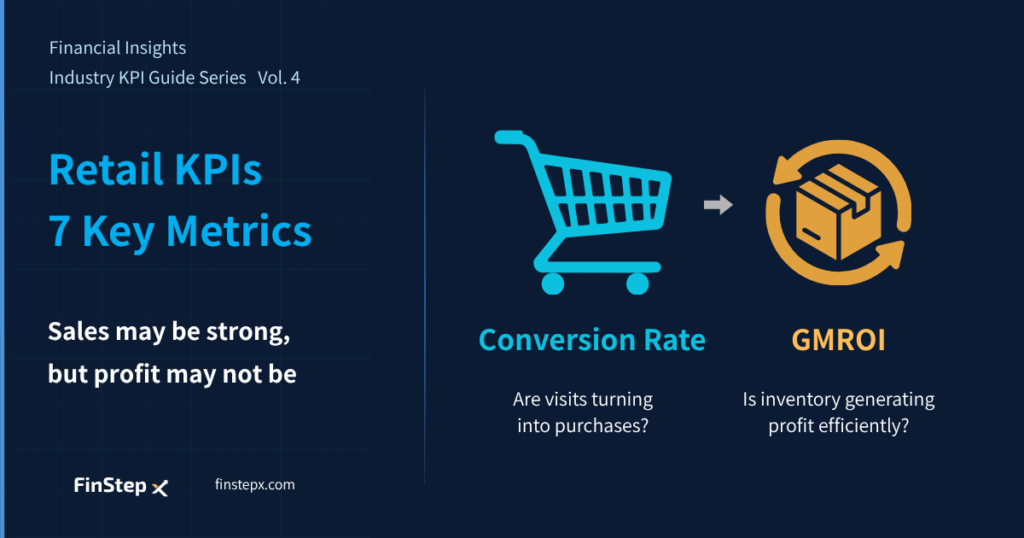
Retail KPIs: 7 Key Metrics, Starting with Conversion Rate and GMROI
Financial Analytics & Automation
-
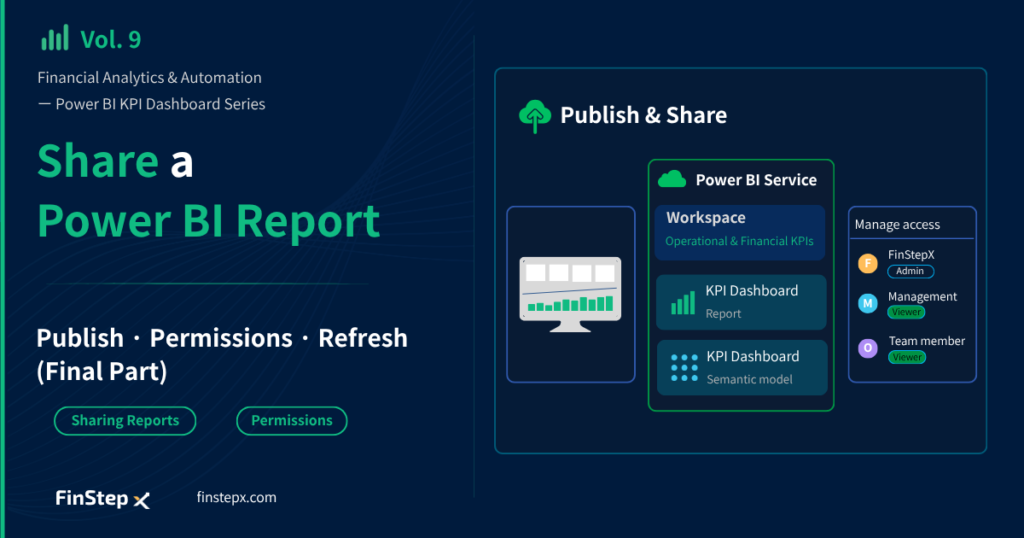
[Vol.9] How to Share a Power BI Report: Publish and Set Permissions
-
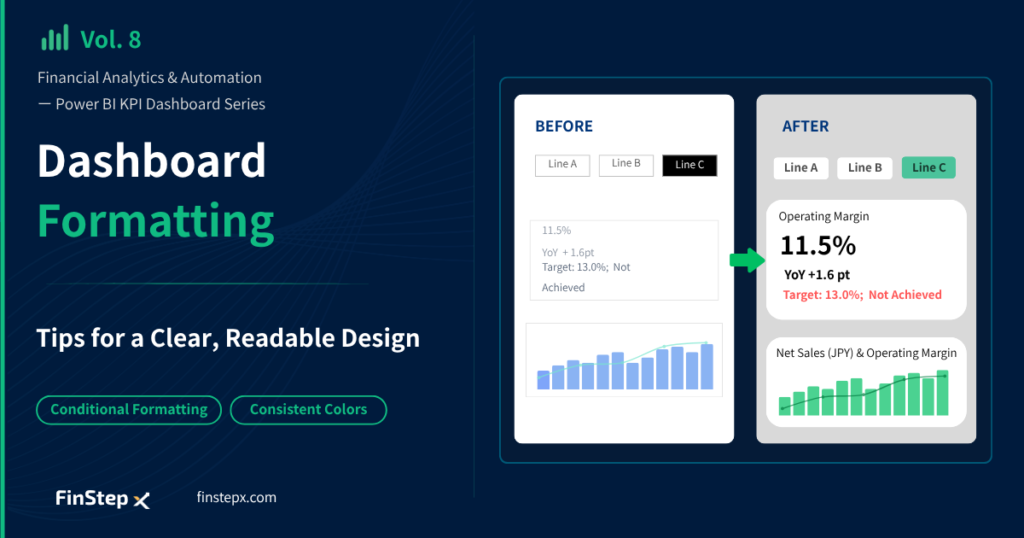
[Vol. 8] How to Format a Power BI Dashboard: Fonts, Colors and Layout
-
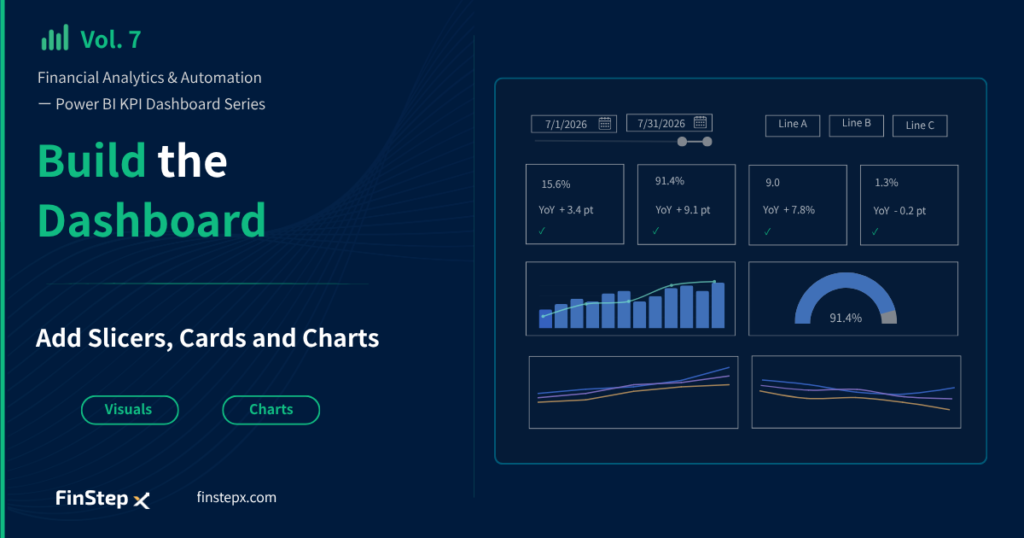
[Vol.7] How to Add Slicers, Cards and Charts in Power BI: Dashboard Layout
-
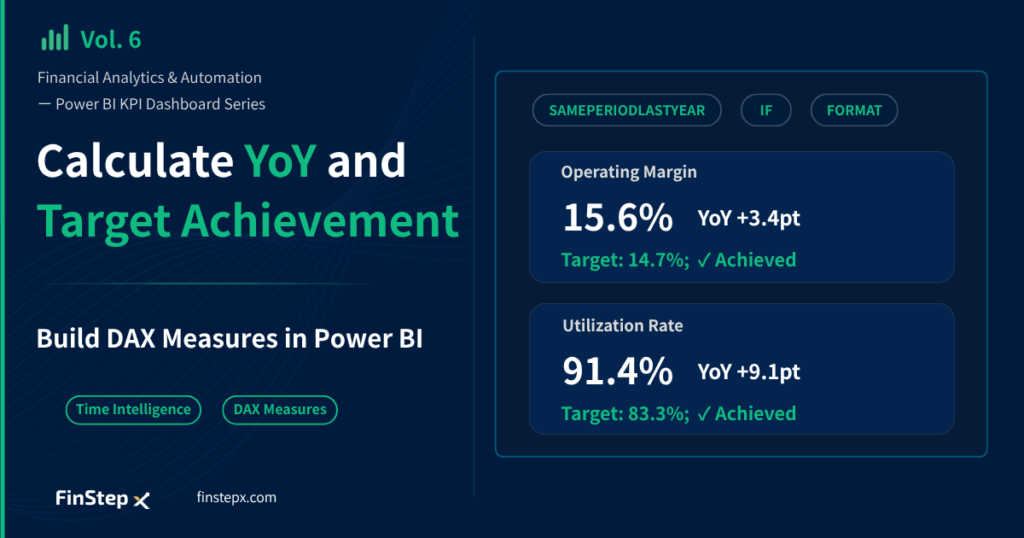
[Vol. 6] How to Calculate YoY and Target Achievement in Power BI: DAX Measures
-
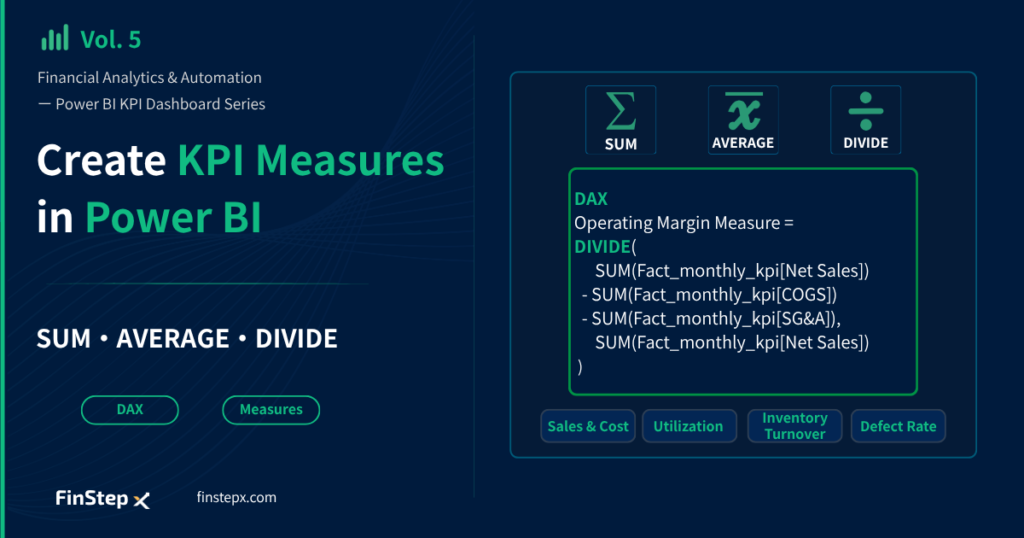
[Vol. 5] How to Create Power BI KPI Measures: DAX SUM, AVERAGE and DIVIDE
-
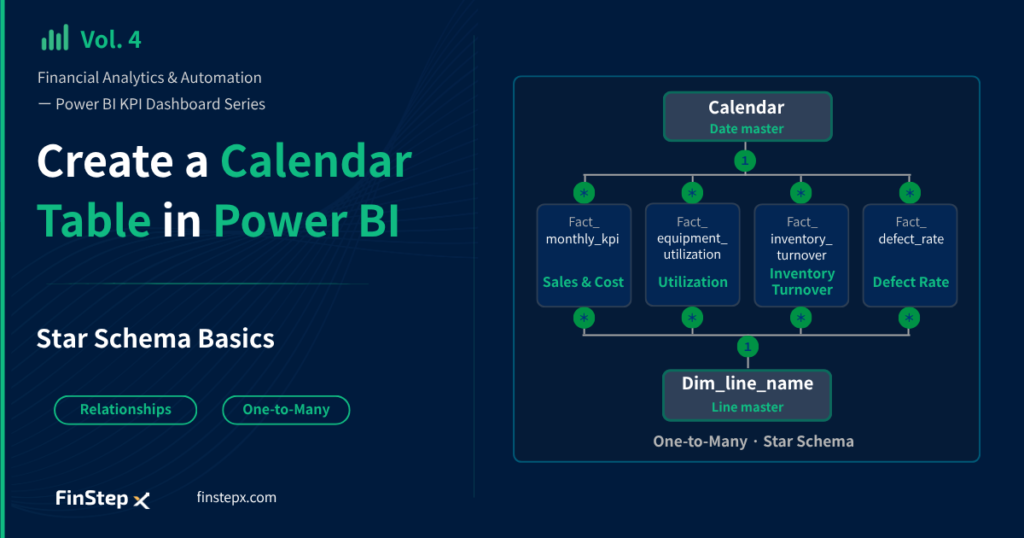
[Vol. 4] How to Create a Calendar Table in Power BI: DAX & Relationships
Recommended Articles
Ready to strengthen your financial operations?
From cash flow improvement to decision-ready financial systems,
we help businesses build stronger financial foundations.
Feel free to start with a free consultation.
60-minute online consultation.
No financial data or documents required.