


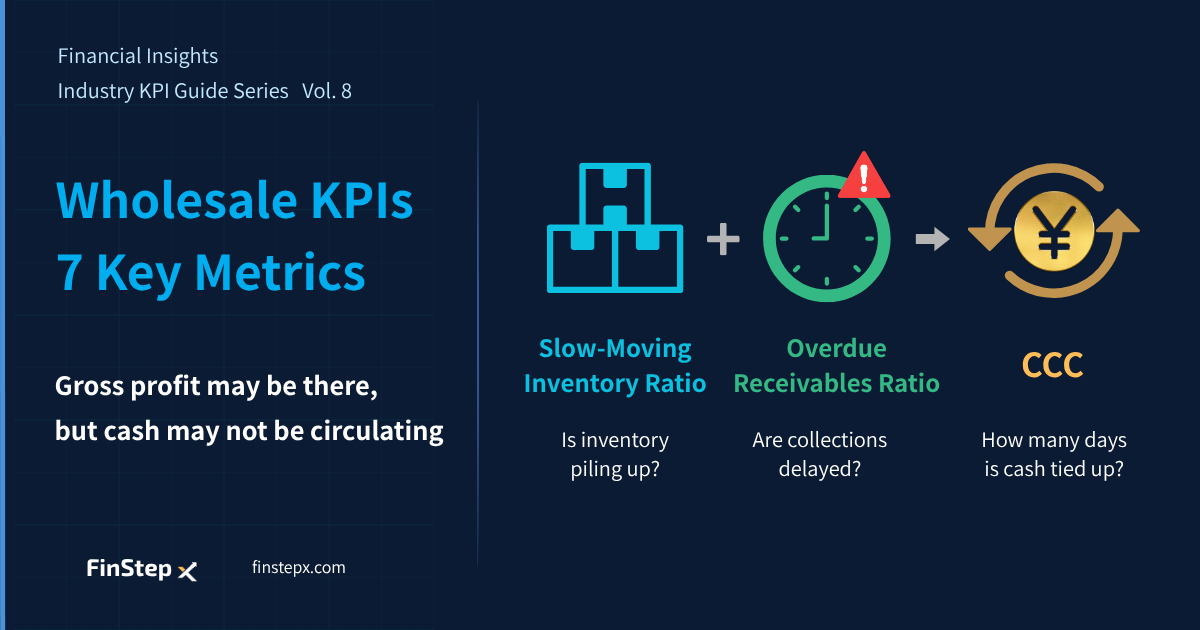
Financial Insights | Industry KPI Guide Series Vol. 8
The bottom line:
For wholesale businesses, three metrics deserve particular attention: the Slow-Moving Inventory ratio, the Overdue Receivables Ratio, and, ultimately, the CCC (Cash Conversion Cycle).
Wholesalers typically operate on relatively thin margins. When inventory sits on the shelf or customers take longer to pay, cash can quickly become tied up. The warning signs often appear in the numbers well before they show up in the financial statements. CCC brings these effects together by showing how many days the company’s cash remains tied up in the operating cycle.
Start by identifying whether the problem is coming from inventory or credit management, using the first two metrics. Then use CCC to understand the overall impact on cash. This is the basic framework for managing a wholesale business.
Why Can a Wholesale Business Struggle with Cash Flow Even When It Is Profitable?
Wholesalers purchase products from manufacturers and sell them to retailers and other businesses, acting as an intermediary between suppliers and customers.
Wholesale businesses tend to generate large sales volumes. However, margins can be relatively thin depending on the products and business model, so higher sales do not necessarily translate into higher profits.
There are also two structural burdens that wholesalers need to manage:
- Inventory burden: Wholesalers often need to maintain a wide range of products to avoid stockouts. When products do not sell, cash becomes tied up in inventory.
- Credit burden: Because wholesalers frequently sell on credit to many customers, delayed payments or bad debts can have a significant impact on both profitability and cash flow.
This is why inventory management and credit management are central to cash flow management in wholesale businesses.
The Wholesale Business Lifecycle and Its KPIs
The flow of revenue and cash in a wholesale business can be viewed as a sequence:
Procurement & Inventory ➜ Sales ➜ Collection ➜ Cash Efficiency
Problems with inventory or receivables can put pressure on cash in the following way:
Slow-moving inventory & overdue receivables ➜ Longer CCC ➜ Higher working capital requirements
The key is not to look at each KPI in isolation, but to understand how profitability, inventory, credit, and payment terms are connected. That is the foundation of effective management in the wholesale industry.
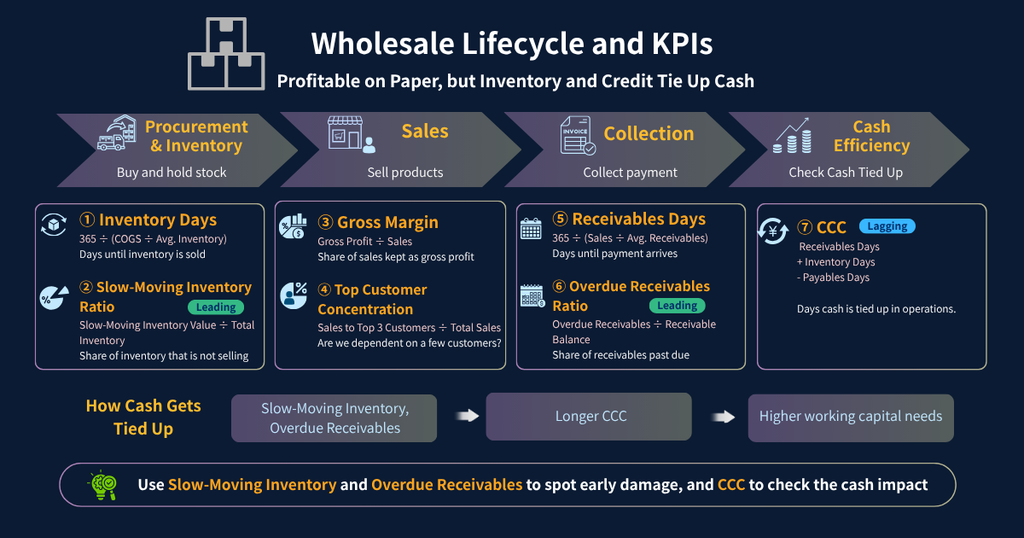
7 Key KPIs for Wholesale Industry
| Phase | KPI | Formula | What to Look For* |
|---|---|---|---|
| Procurement & Inventory | Inventory Days | 365 ÷ (Cost of Goods Sold ÷ Average Inventory) | YoY trend and peer comparison |
| Procurement & Inventory | Slow-Moving Inventory Ratio | Slow-Moving Inventory Value ÷ Total Inventory Value | Value by aging period, trend in the ratio |
| Sales | Gross Margin | Gross Profit ÷ Sales | Trends by product and customer |
| Sales | Top Customer Concentration | Sales to Top 3 Customers ÷ Total Sales | Trend in concentration |
| Collection | Receivables Days | 365 ÷ (Sales ÷ Average Accounts Receivable) | Comparison with company average, trends by customer |
| Collection | Overdue Receivables Ratio | Overdue Receivables ÷ Receivable Balance | Overdue amounts, trend in long-overdue receivables |
| Cash Efficiency | CCC | Receivables Days + Inventory Days − Payables Days | Comparison with company average |
① Inventory Days | How Long Is Cash Tied Up in Inventory?
Inventory Days = 365 ÷ (Cost of Goods Sold ÷ Average Inventory)Inventory Days shows how long it takes, on average, for inventory to be sold. The higher the number, the longer cash remains tied up in inventory.
Because wholesalers often carry a large number of products, looking beyond the overall average can reveal where inventory is actually getting stuck. Analyzing the metric by product or category can help pinpoint the source of the problem.
② Slow-Moving Inventory Ratio | How Much Inventory Is Sitting Idle?
Slow-Moving Inventory Ratio = Slow-Moving Inventory Value ÷ Total Inventory ValueThis metric shows the percentage of total inventory that has not moved for a specified period, such as six months.
Slow-moving inventory creates more than just a risk of write-downs or disposal. It also takes up warehouse space and ties up cash that could otherwise be used elsewhere in the business.
There is no universal threshold for determining when the ratio becomes “dangerous.” What matters is monitoring whether inventory is staying idle for longer and whether the value of slow-moving inventory is continuing to increase.
③ Gross Margin | Are Individual Sales Generating Enough Profit?
Gross Margin = Gross Profit ÷ SalesGross margins vary significantly depending on the products sold and the business model.
Rather than looking only at the absolute level, compare the margin with the previous month and year, and analyze it by product and customer. When margins deteriorate, investigate possible causes such as lower selling prices, higher purchasing costs, changes in product mix, or excessive discounts for specific customers.
In practice, combining customer-level gross profit with collection terms can help identify customers who generate significant sales but place a heavy burden on the business in terms of both profitability and cash flow.
④ Top Customer Concentration | Are You Too Dependent on a Few Customers?
Top Customer Concentration = Sales to Top 3 Customers ÷ Total SalesThe more dependent a business is on a small number of customers, the more directly those customers’ financial difficulties or changes in commercial terms can affect the business.
Monitor changes in customer concentration along with the customers’ creditworthiness, contract terms, and increases in accounts receivable balances.
⑤ Receivables Days | How Long Does It Take to Collect After a Sale?
Receivables Days = 365 ÷ (Sales ÷ Average Accounts Receivable)For wholesalers that make significant use of credit sales, longer collection periods can quickly put pressure on cash flow.
It is important to look beyond the company-wide average and monitor collection performance by customer.
Aging receivables into categories such as 30+, 60+, and 90+ days overdue can help identify payment delays from individual customers at an early stage.
⑥ Overdue Receivables Ratio | How Much of Your Receivables Are Past Due?
Overdue Receivables Ratio = Overdue Receivables ÷ Accounts Receivable BalanceThis metric shows the percentage of accounts receivable that remains uncollected after the payment due date.
For wholesalers, the goal should not be to wait until a bad debt occurs before taking action. Detecting payment delays early is critical.
In addition to the overdue ratio, monitor customer-level aging and whether customers are exceeding their approved credit limits.
⑦ CCC | How Many Days Is Cash Tied Up in the Business?
CCC = Receivables Days + Inventory Days − Payables Days
Payables Days = 365 ÷ (Cost of Goods Sold ÷ Average Accounts Payable)
The CCC (Cash Conversion Cycle) measures how long cash remains tied up between purchasing inventory, selling the products, and collecting payment from customers.
The shorter the CCC, the less working capital the business needs to support its operations.
Because wholesalers typically carry both inventory and accounts receivable, managing CCC is particularly important from a cash-efficiency perspective.
Warning Signals: Reading Business Risks Through KPI Changes
| KPI | Warning Signal | Business Risks | First Action |
| Inventory Days | Worsening for 3 consecutive months | More cash tied up in inventory | Identify slow-moving products/categories and review purchasing volumes |
| Slow-Moving Inventory Ratio | Rising for 2 consecutive months, or slow-moving inventory value rises sharply | Write-downs, disposal, and cash pressure | Define actions by aging period: continue selling, discount, return, or dispose |
| Gross Margin | Declines for 2 consecutive months | Lower profitability | Break down by customer and product and identify unusual discounting |
| Top Customer Concentration | Concentration increases while receivables also rise | Customer deterioration directly hits the business | Review contract terms and credit exposure and reduce concentration |
| Receivables Days | More than 15 days above the company average | Deteriorating cash flow | Analyze customer-level aging and review collection terms |
| Overdue Receivables Ratio | Increases for 2 consecutive months, or a specific customer overdue for more than 60 days | Higher bad-debt risk | Reassess credit limits and strengthen collection procedures |
| CCC | More than 30 days above the company average | Higher working capital requirements | Break down whether the increase comes from inventory, receivables, or payables |
How to Conduct a KPI Review
Step 1: Start with the results
Start with revenue, gross margin, and operating profit. Compare them with the previous month and the same month last year to understand how the business is performing.
Step 2: Identify the drivers
Review inventory days, the slow-moving inventory ratio, top customer concentration, and other operational KPIs to understand what is driving changes in profitability and cash flow.
Step 3: Review the impact on cash flow
Review receivables days, the overdue receivables ratio, and CCC to identify factors that could affect future cash flow.
Step 4: Decide on actions
Turn the findings into specific actions—for example, discounting slow-moving inventory, adjusting purchasing volumes, renegotiating collection terms, or resetting customer credit limits. Make clear who will do what and by when.
Summary
Looking only at revenue, a lagging indicator, can cause businesses to overlook structural problems such as slow-moving inventory, excessive dependence on a few customers, and delayed receivables collection.
To understand the financial health of a wholesale business, it is important to look at KPIs together. This provides a broader view—not only of profitability, but also of how much cash is tied up in inventory, how quickly receivables are collected, how concentrated the customer base is, and how much working capital the business needs.
The seven KPIs covered in this article can be summarized as follows:
| Phase | KPI | Key Points to Check | Business Impact |
| Procurement & Inventory | Inventory Days | Where is inventory sitting, and for how long? | Cash tied up in inventory |
| Procurement & Inventory | Slow-Moving Inventory Ratio | How much inventory has been idle for a long time? | Write-down and disposal risk |
| Sales | Gross Margin | How are pricing and purchasing costs affecting profitability? | Foundation of profitability |
| Sales | Top Customer Concentration | How dependent is the business on a small number of customers? | Business continuity risk |
| Collection | Receivables Days | How quickly are customers paying? | Impact on cash flow |
| Collection | Overdue Receivables Ratio | How much collection is overdue? | Bad-debt risk |
| Cash Efficiency | CCC | How long is cash tied up in the operating cycle? | Working capital requirements |
The purpose of KPI management in wholesale is to identify where inventory and credit risks are emerging and how significant they are, then take action before they begin to put serious pressure on cash flow.
Frequently Asked Questions
1. What is the most important KPI for a wholesale business?
The slow-moving inventory ratio, overdue receivables ratio, and the resulting CCC are particularly important.
The first two metrics help identify whether problems are emerging from inventory or credit management. CCC then shows the overall impact on cash.
2. Can a wholesale company be healthy even with a low gross margin?
Yes.
Even with a low gross margin, a wholesaler can generate a reasonable return if it sells products quickly and collects receivables promptly. By turning the same pool of invested capital over repeatedly, the business can still generate sufficient profit.
Gross margin is therefore only part of the picture. Sales velocity, collection speed, and the number of times capital turns over are also important.
3. What level of top customer concentration is considered safe?
There is no universal threshold.
A business with high customer concentration may still be relatively stable if those customers have strong credit profiles and commercial terms are reliable. What matters more than the absolute level is the trend and how well the business is prepared for the associated risk.
4. How should slow-moving inventory be handled?
Consider options such as discounting, negotiating returns with suppliers, or finding alternative sales channels, depending on the characteristics of the products.
It is useful to visualize inventory by aging period and establish a clear policy for items that remain unsold beyond a certain point—for example, whether to continue selling, discount, return, or dispose of them.
5. How often should these KPIs be reviewed?
Monthly review should be the baseline. However, collection status and credit-limit utilization may need to be monitored more frequently.
The goal is to detect issues such as long-overdue receivables or a sudden increase in inventory for specific products before the monthly closing process is complete.
Next Article
Financial Insights | Industry KPI Guide Series Vol. 9
Logistics & Transportation KPIs: 7 Key Metrics, Starting with Vehicle Utilization and Operating Cost Ratio