


Financial Insights | Industry KPI Guide Series Vol. 6
The bottom line:
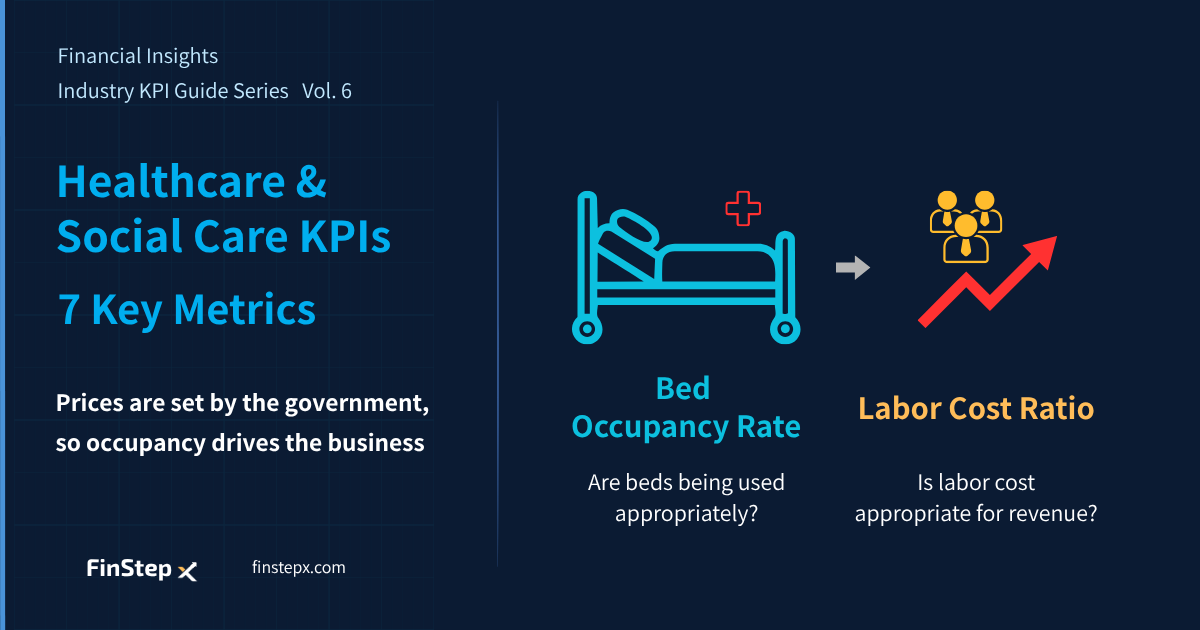
The two KPIs to look at first when managing a healthcare or social care organization are Bed Occupancy (or occupancy/utilization for care facilities) and Labor Cost Ratio.
Because reimbursement rates for medical and long-term care services are largely set by the government, one of the main ways providers can influence revenue is by keeping their facilities operating at an appropriate level of capacity.
At the same time, staffing levels cannot be reduced easily when occupancy falls because healthcare and care providers must meet regulatory staffing requirements. As occupancy declines, the impact quickly shows up in the labor cost ratio.
In other words, Occupancy tells you where the change starts, while the Labor Cost Ratio shows you how large the financial impact is. Once you understand this relationship, it becomes easier to choose the right response—whether that means strengthening patient referrals and community partnerships or reviewing staffing levels and schedules.
Why Revenue Alone Doesn’t Tell You How a Healthcare Organization Is Performing
Healthcare providers and social care organizations operate under a very different business model from most commercial companies.
In a typical business, management can improve margins by reducing costs or raising prices.
Healthcare and long-term care are different. A large portion of revenue comes from medical reimbursement and long-term care reimbursement, where prices are largely set by government reimbursement schedules. Providers generally cannot set their own prices freely.
As a result, improving revenue is primarily about operational factors such as attracting more patients or residents, maintaining occupancy, and optimizing length of stay.
Healthcare and social care are also highly labor-intensive. Labor costs often account for more than half of total costs.
This creates a structural challenge: providers have limited ability to raise prices, while labor costs continue to rise.
For that reason, management should not monitor only outcome metrics such as medical revenue or care-service revenue. It is equally important to track KPIs that capture both the revenue and cost sides of the business, including occupancy, length of stay, labor cost ratio, and the collection of outstanding receivables.
The Healthcare & Social Care Operating Lifecycle and Its KPIs
Revenue in healthcare and social care builds through a sequence:
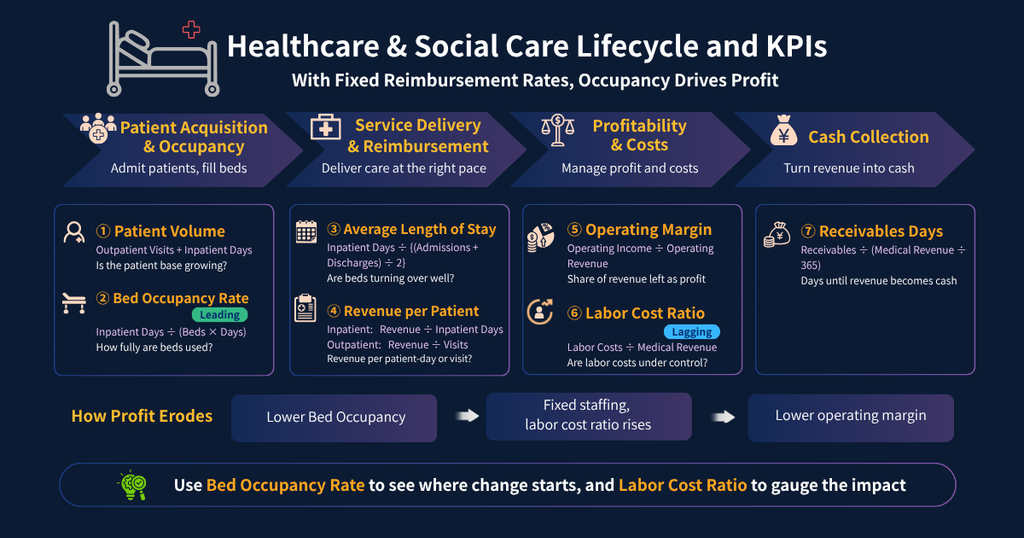
Patient Acquisition & Occupancy ➜ Service Delivery & Reimbursement ➜ Profitability & Costs ➜ Cash Collection
Because staffing requirements are regulated, staffing levels cannot simply be reduced when occupancy falls. As a result, lower occupancy can directly push up the labor cost ratio.
Lower bed occupancy ➜ Staffing cannot be reduced proportionally ➜ Higher labor cost ratio ➜ Lower operating margin
7 Key KPIs for Healthcare & Social Care Industry
| Phase | KPI | Formula | What to Look For* |
|---|---|---|---|
| Patient Acquisition & Occupancy | Patient Volume | Total Outpatient Visits + Total Inpatient Days | YoY and vs. plan |
| Patient Acquisition & Occupancy | Bed Occupancy Rate | Total Inpatient Days ÷ (Operational Beds × Days) | Around 70–80% (National average for general hospital beds is around 68%) |
| Service Delivery & Reimbursement | Average Length of Stay | Total Inpatient Days ÷ {(New Admissions + Discharges) ÷ 2} | Around 10–16 days for acute care hospitals (varies by facility standards) |
| Service Delivery & Reimbursement | Revenue per Patient | Inpatient: Inpatient Medical Revenue ÷ Inpatient Days Outpatient: Outpatient Medical Revenue ÷ Outpatient Visits | Varies by specialty and bed function |
| Profitability & Costs | Operating Margin | Operating Income ÷ Operating Revenue | Focus on the trend |
| Profitability & Costs | Labor Cost Ratio | Labor Costs ÷ Medical Revenue | Around 50–60% for general hospitals; Around 60–75% for care facilities |
| Cash Collection | Receivables Days | Medical Receivables ÷ (Medical Revenue ÷ 365) | Around 2 months for insured medical services in Japan |
① Patient Volume | The Starting Point for Patient Acquisition
Total Patient Volume = Total Outpatient Visits + Total Inpatient Days

Total Outpatient Visits = Total number of outpatient visits during a given period
Total Inpatient Days = Sum of the number of inpatients on each day
Patient volume is the foundation of revenue. It combines outpatient visits with inpatient days.
It is important not to look only at the overall change in patient volume. Break it down into new patients, returning patients, and referred patients.
If referrals are declining, for example, the organization may have an issue with its relationships with local healthcare providers, referral pathways, or community partnerships.
② Bed Occupancy Rate | How Fully Are Your Beds Being Used?
Bed Occupancy Rate = Total Inpatient Days ÷ (Operational Beds × Number of Days)When reimbursement rates are largely fixed, the ability to keep beds occupied becomes critical to revenue generation.
Fixed costs such as labor and facilities costs do not fall in proportion to occupancy. As a result, a decline in occupancy can quickly translate into lower operating margins.
However, an occupancy rate that remains excessively high can signal a different set of problems, such as insufficient capacity to accept emergency admissions or excessive workload for staff.
The goal is therefore not simply to maximize occupancy, but to maintain an appropriate and sustainable level of utilization.
③ Average Length of Stay | How Quickly Are Beds Turning Over?
Average Length of Stay = Total Inpatient Days ÷ {(New Admissions + Discharges) ÷ 2}A shorter length of stay generally means faster bed turnover, allowing a hospital to treat more patients with the same number of beds.
However, reducing length of stay too aggressively can create other problems. If adequate post-discharge support—such as community-based care, home healthcare, or long-term care facilities—is not available, patients may be discharged before the appropriate support is in place, potentially increasing readmissions.
Length of stay should therefore always be reviewed together with occupancy.
④ Revenue per Patient | How Much Revenue Is Generated per Patient?
Inpatient Revenue per Patient Day = Inpatient Medical Revenue ÷ Total Inpatient Days
Outpatient Revenue per Visit = Outpatient Medical Revenue ÷ Total Outpatient Visits
Revenue per patient is largely determined by government reimbursement schedules, so providers cannot freely set their own rates.
However, it can change depending on the services provided, eligible reimbursement add-ons, and the mix of treatments and patients.
⑤ Operating Margin | How Much Profit Is Left from Revenue?
Operating Margin = Operating Income ÷ Operating Revenue
Operating Income = Operating Revenue − Operating Expenses
Many healthcare organizations operate with relatively low operating margins. This reflects the combination of regulated reimbursement rates and significant costs for labor, medical supplies, and facilities and equipment.
Rather than looking only at whether the organization was profitable or unprofitable in a single year, management should monitor the trend and examine it alongside underlying drivers such as occupancy and labor cost ratio.
⑥ Labor Cost Ratio | A Key Indicator of the Cost Structure
Labor Cost Ratio = Labor Costs (Personnel Costs) ÷ Medical RevenueHealthcare, long-term care, and social care are labor-intensive industries, so labor costs tend to account for a larger share of revenue than in many other sectors.
In care facilities in particular, regulatory staffing requirements can make it difficult to reduce staffing significantly even when occupancy falls. This makes the labor cost ratio particularly sensitive to changes in occupancy.
When the labor cost ratio deteriorates, simply cutting headcount is often not the best response. Management should also consider shift optimization, redesigning work responsibilities, and productivity improvements through technologies such as care robots and automation.
⑦ Receivables Days | How Quickly Is Revenue Converted into Cash?
Receivables Days = Medical Receivables ÷ (Medical Revenue ÷ 365)A large portion of healthcare revenue comes from insured medical services, creating a typical lag of around two months between claim submission and payment.
If Receivables Days becomes significantly longer than the organization’s normal cycle, it warrants investigation.
High levels of claim rejections or payment reductions following review may indicate problems in the claims process and can have a direct impact on cash flow.
Warning Signals: Reading Business Risks Through KPI Changes
| KPI | Warning Signal | Business Risks | First Action |
|---|---|---|---|
| Patient Volume | Below prior year for 2 consecutive months | Shrinking revenue base | Break down new, referred, and returning patients; review referral partners |
| Bed Occupancy Rate | Below 65%, or above 90% for a sustained period | Insufficient revenue to cover fixed costs / operational strain | Review referral channels, community partnerships, and bed utilization |
| Average Length of Stay | Changes of more than ±10% YoY | Reimbursement risk / higher readmission risk | Review discharge planning and community care pathways |
| Revenue per Patient | Below prior year for 2 consecutive months | Deteriorating revenue mix | Review services provided and reimbursement add-ons |
| Operating Margin | Negative for multiple periods | Potential structural viability issue | Review specialty mix and bed functions |
| Labor Cost Ratio | Increase of 2 percentage points or more YoY | Pressure on profitability | Optimize staffing levels and shift schedules |
| Receivables Days | More than 15 days above your historical average | Cash flow deterioration / increased claim issues | Review the claims and billing process |
How to Conduct a KPI Review
Step 1: Start with the results
Compare bed occupancy, revenue per patient, and medical revenue with the previous month, prior year, and plan to understand where the current month is likely to land.
Step 2: Identify the drivers
Break down changes in patient volume into new patients, referrals, and returning patients. Then determine whether changes in occupancy are driven by patient acquisition or by changes in length of stay.
Step 3: Review costs and cash
Use the labor cost ratio to assess the health of the cost structure and Receivables Days to understand how quickly revenue is being converted into cash. Then use operating margin to evaluate overall profitability.
Step 4: Decide on actions
Translate the findings into specific actions around community partnerships, staffing, scheduling, claims processing, and other operational areas. Make it clear who will do what and by when.
Summary
Healthcare and social care KPIs are connected by one fundamental constraint: providers have limited control over the prices they can charge.
That makes the ability to manage occupancy and the cost structure particularly important.
The seven KPIs covered in this article can be summarized as follows:
| Phase | KPI | Key Points to Check | Impact on Management |
|---|---|---|---|
| Patient Acquisition & Occupancy | Patient Volume | How are new, referred, and returning patients trending? | Revenue base |
| Patient Acquisition & Occupancy | Bed Occupancy Rate | How fully are beds being used? | Revenue generation |
| Service Delivery & Reimbursement | Average Length of Stay | Are beds turning over at an appropriate pace? | Bed turnover / readmission risk |
| Service Delivery & Reimbursement | Revenue per Patient | Is revenue per inpatient day or outpatient visit appropriate? | Revenue structure |
| Profitability & Costs | Operating Margin | How much profit remains after operating costs? | Overall financial health |
| Profitability & Costs | Labor Cost Ratio | Are labor costs at an appropriate level? | Profitability |
| Cash Collection | Receivables Days | How quickly is revenue being converted into cash? | Cash flow |
Looking only at medical revenue, a lagging indicator, can cause management to miss how changes in occupancy are flowing through to labor costs and ultimately to profitability.
By monitoring bed occupancy, length of stay, labor cost ratio, and Receivables Days together, management can develop a much clearer picture of the organization’s financial health.
The purpose of KPI management in healthcare and social care is not simply to track numbers. It is to understand how changes in occupancy affect labor costs and profitability, and then use those insights to make better decisions about community partnerships, staffing, and operational processes.
Frequently Asked Questions
1. What are the most important KPIs in healthcare and social care?
The two most important starting points are bed occupancy and labor cost ratio.
Because medical and long-term care reimbursement rates are largely set by the government, providers have limited ability to increase prices. Occupancy therefore becomes one of the main drivers of revenue.
When occupancy declines, staffing costs often cannot be reduced proportionally because of regulatory staffing requirements. This can cause the labor cost ratio to rise.
2. What is an appropriate bed occupancy rate?
The national average for general hospital beds in Japan is around 68%, according to the Ministry of Health, Labour and Welfare’s Hospital Report.
However, the appropriate level varies significantly depending on the type of beds, such as acute, rehabilitation, and chronic care.
Rather than relying on a simple comparison with the national average, management should focus on the organization’s own historical trend and comparisons with similar hospitals.
3. Why are labor cost ratios relatively high in healthcare and social care?
Healthcare, long-term care, and social care are labor-intensive industries. In addition, regulations establish minimum staffing requirements in many settings.
This makes it difficult to reduce staffing quickly when occupancy declines, which means labor costs can represent a higher proportion of revenue than in many other industries.
4. What are the main reasons Receivables Days becomes longer?
For insured medical services, there is typically a lag of around two months between submitting claims and receiving payment.
In addition, a high number of claim rejections or payment reductions following review can delay collection further.
5. Are there differences between healthcare providers and social care facilities?
The basic framework is similar.
For care facilities, bed occupancy can be replaced by occupancy or utilization, while revenue per patient can be viewed in terms of reimbursement revenue per resident or service user.
However, care facilities may face particularly strict staffing requirements, making their labor cost ratios more sensitive to changes in occupancy.
Next Article
Financial Insights | Industry KPI Guide Series Vol. 7
Real Estate Rental KPIs: 7 Key Metrics, Starting with Occupancy Rate and NOI