


Financial Insights | Industry KPI Guide Series Vol. 5
The bottom line:
The two KPIs to look at first in a SaaS business are Churn Rate and NRR (Net Revenue Retention).
Even if new contracts are growing, monthly recurring revenue (MRR) can remain flat if customers are churning at the same pace. Meanwhile, the cost of acquiring new customers continues to rise. Churn rate is the first metric to show where revenue is leaking from the business.
NRR, on the other hand, tells you whether revenue lost through churn and downgrades is being offset by expansion from existing customers.
Looking at these two metrics together helps answer a fundamental question: Is the business truly growing, or is the apparent growth simply being driven by new customer acquisition?
Why Doesn’t the Business Grow Even When New Contracts Are Increasing?
SaaS businesses generate recurring revenue through monthly or annual subscriptions. Once a customer signs a contract, the business can build a relatively stable stream of recurring revenue each month, making SaaS an attractive business model.
But if customers are churning at roughly the same pace as new customers are being acquired, revenue will not grow. Acquiring new customers requires upfront investment in areas such as advertising and sales personnel. If churn remains high while the company continues to focus heavily on new customer acquisition, costs can keep rising without generating meaningful profit.
Looking only at outcome metrics such as revenue and customer count can make these problems difficult to spot until it is too late. In many cases, warning signs such as rising churn and declining product usage appear several months before the impact becomes visible in revenue.
That is why SaaS companies need to continuously monitor KPIs that show how well customers are being retained and expanded, rather than looking at revenue alone.
The SaaS Business Lifecycle and Its Key KPIs
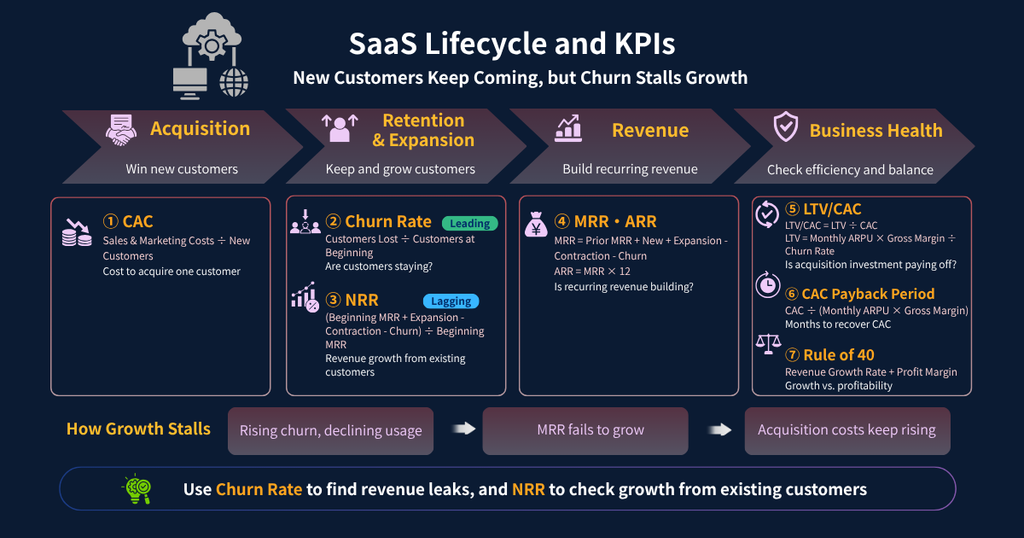
Revenue in a SaaS business builds through a sequence of Acquisition ➜ Retention & Expansion ➜ Revenue ➜ Business Health.
Customer churn can disrupt this growth cycle:
Rising churn and declining usage ➜ MRR fails to grow ➜ customer acquisition costs continue to increase
The key is not to look at each KPI in isolation, but to understand where the bottleneck lies in the journey from customer acquisition to revenue generation.
7 Key KPIs for the SaaS Industry
| Phase | KPI | Formula | What to Look For* |
|---|---|---|---|
| Acquisition | CAC | Sales & Marketing Costs ÷ New Customers Acquired | Varies by business stage and customer segment |
| Retention & Expansion | Churn Rate | Customers Lost ÷ Customers at Beginning of Period (monthly) | Enterprise: below 1% monthly SMB: 3–5% monthly |
| Retention & Expansion | NRR | (Beginning MRR + Expansion – Contraction – Churn) ÷ Beginning MRR | Over 100%: expanding 120%+: strong (annual) |
| Revenue | MRR & ARR | Beginning MRR + New + Expansion – Contraction – Churn (ARR = MRR × 12) | +10–15% MoM (early stage) |
| Business Health | LTV & LTV/CAC Ratio | LTV = Monthly ARPU × Gross Margin ÷ Monthly Churn Rate | LTV/CAC of 3x or more |
| Business Health | CAC Payback Period | CAC ÷ (Monthly ARPU × Gross Margin) | Within 12 months |
| Business Health | Rule of 40 | Revenue Growth Rate + Profit Margin | 40% or more |
① CAC | How Much Does It Cost to Acquire One Customer?
CAC = Sales & Marketing Costs ÷ New Customers AcquiredCAC (Customer Acquisition Cost) includes costs such as advertising, sales salaries, and the cost of running inside sales activities.
CAC cannot be evaluated on its own. Only by looking at it alongside LTV—the revenue or profit a customer generates over their lifetime—can you determine whether the investment in customer acquisition is paying off.
② Churn Rate | Are Customers Staying?
Customer Churn Rate (Monthly) = Customers Lost ÷ Customers at Beginning of Period
Revenue Churn Rate (Monthly) = (Churned MRR + Contraction MRR) ÷ Beginning MRR
There are two main ways to measure churn: customer churn, which is based on the number of customers, and revenue churn, which is based on recurring revenue.
Looking only at customer churn can cause you to overlook the impact of losing a large customer.
For SaaS businesses with customers at different price points, it is important to monitor both metrics together.
When churn starts to rise, it often points to retention problems such as insufficient onboarding (support to help new customers get started), declining product usage, or key features not being used.
③ NRR | How Much Can You Grow From Existing Customers?
NRR = (Beginning MRR + Expansion – Contraction – Churn) ÷ Beginning MRR
    = 1 – Revenue Churn Rate + Expansion Rate
NRR (Net Revenue Retention) measures how revenue from existing customers changes over time, without including new customers. NRR is typical measured over 12 months, comparing the MRR of the same customer group at the start and end of the period.
- Below 100%: Revenue from existing customers is shrinking
- 100%: Revenue from existing customers is being maintained
- Above 100%: Revenue from existing customers is growing
- 120%+: A strong benchmark for SaaS businesses (annual)
Companies with high NRR are generally considered to have a strong revenue base because they can grow through upselling and cross-selling to existing customers, rather than relying entirely on new customer acquisition.
④ MRR & ARR | The Foundation of SaaS Revenue
Current MRR = Beginning MRR + New + Expansion – Contraction – Churn
ARR = MRR × 12
MRR (Monthly Recurring Revenue) is the total recurring subscription revenue generated each month.
ARR (Annual Recurring Revenue) is the annualized value of MRR.
Breaking MRR down by its individual components reveals what is really driving growth. This is essential for avoiding situations where revenue appears to be growing while the business is actually becoming increasingly dependent on new customer acquisition and losing existing customers at the same time.
⑤ LTV & LTV/CAC Ratio | How Much Profit Does Each Customer Generate Over Their Lifetime?
LTV = Monthly ARPU × Gross Margin ÷ Monthly Churn Rate
LTV/CAC Ratio = LTV ÷ CAC
The lower the churn rate, the longer customers tend to stay, which increases LTV (Lifetime Value). This is why churn and LTV are so closely connected.
- LTV/CAC ratio below 3x: Customer acquisition may not be generating sufficient returns
- LTV/CAC ratio of 10x or higher: The company may be underinvesting in growth and missing opportunities to scale
⑥ CAC Payback Period | How Quickly Can You Recover Customer Acquisition Costs?
CAC Payback Period (Months) = CAC ÷ (Monthly ARPU × Gross Margin)The CAC payback period is particularly important from a cash flow perspective.
The longer it takes to recover customer acquisition costs, the more working capital the business needs to support continued growth.
For ARPU (Average Revenue Per User), use the monthly revenue from new customers.
Using an average that includes existing customers can distort the picture because their pricing and contract terms may differ from those of newly acquired customers.
⑦ Rule of 40 | Balancing Growth and Profitability
Rule of 40 = Revenue Growth Rate + Profit Margin (operating margin or FCF margin)SaaS companies typically go through phases where they prioritize growth and continue investing despite losses, followed by phases where profitability becomes more important. Looking at either growth or profitability alone does not provide a complete picture of business health.
The Rule of 40 combines the two and uses a 40% threshold as a general way to assess the balance between growth and profitability.
Warning Signals: Reading Business Risks Through KPI Changes
| KPI | Warning Signal | Business Risks | First Action |
|---|---|---|---|
| CAC | Rising YoY | Lower acquisition efficiency | Break down CAC by channel and review underperforming initiatives |
| Churn Rate | Rising for 2 consecutive months | Customer retention problems | Review onboarding and customer support |
| NRR | Below 100% | Existing-customer revenue is shrinking | Analyze churn reasons and strengthen expansion initiatives |
| MRR | Declining MoM for 2 consecutive months | Slowing growth | Break down the drivers of both new business and expansion |
| LTV/CAC Ratio | Below 3x | Insufficient return on acquisition investment | Reassess target customers and pricing strategy |
| CAC Payback Period | More than 12 months | Declining capital efficiency | Review sales and marketing spend allocation |
| Rule of 40 | Below 40% for a sustained period | Slowing growth and/or profitability | Analyze growth and profitability separately |
How to Conduct a KPI Review
Step 1: Start with the results
Compare MRR and ARR with the previous month, the same period last year, and the plan or budget to understand where the current month is landing.
Step 2: Identify the drivers
Break down the change in MRR into new business, expansion, contraction, and churn to identify what is driving growth or slowing it down.
Step 3: Evaluate Efficiency and Business Health
Review CAC, the LTV/CAC ratio, and the CAC payback period to evaluate the efficiency of customer acquisition investment.
At the same time, use the Rule of 40 to assess the balance between growth and profitability.
Step 4: Decide on actions
Translate the findings into specific actions across areas such as sales capacity, customer success initiatives, and pricing strategy. Make it clear who will do what, and by when.
Summary
SaaS KPIs are interconnected across the entire business cycle, from customer acquisition and retention to expansion and revenue generation. Looking only at revenue can cause you to miss growth that is largely dependent on new customer acquisition.
The seven KPIs covered in this article can be summarized as follows:
| Phase | KPI | Key Points to Check | Business Impact |
|---|---|---|---|
| Acquisition | CAC | Is acquisition spending appropriate? | Profitability |
| Retention & Expansion | Churn Rate | Are customers staying? | Revenue stability |
| Retention & Expansion | NRR | Can we grow from existing customers alone? | Quality of growth |
| Revenue | MRR & ARR | Is recurring revenue building over time? | Revenue growth |
| Business Health | LTV & LTV/CAC Ratio | Are we recovering our customer acquisition investment? | Investment efficiency |
| Business Health | CAC Payback Period | How many months does it take to recover acquisition costs? | Capital efficiency |
| Business Health | Rule of 40 | Are growth and profitability balanced? | Overall business health |
MRR alone can hide a situation where existing customers are gradually leaving the business. By monitoring churn, NRR, and LTV/CAC alongside MRR, management can assess both the quality of growth and the efficiency of customer acquisition investment.
The purpose of SaaS KPI management is to determine whether growth is being driven by new customers or by expansion within the existing customer base, and then use that insight to make better investment decisions.
Frequently Asked Questions
1. What are the most important KPIs in the SaaS industry?
Churn rate and NRR are two of the most important.
Churn rate is a leading indicator of MRR deterioration, while NRR is a lagging (outcome) indicator that shows how revenue from existing customers is changing.
2. What is a good churn rate for a SaaS business?
As a general benchmark:
・Enterprise: less than 1% monthly
・SMB: 3–5% monthly
However, appropriate levels vary by industry, customer segment, and average contract value. Your own historical trends and peer benchmarks should always be considered.
3. What happens when NRR falls below 100%?
Revenue from existing customers is shrinking. It means that churn and contraction are outweighing expansion.
4. What is a good LTV/CAC ratio?
3x or higher is generally considered a healthy benchmark.
A ratio that is too low may indicate that customer acquisition costs are not being recovered efficiently. An extremely high ratio, however, may indicate that the company is being too conservative with growth investment.
5. How often should SaaS KPIs be reviewed?
MRR and churn are typically reviewed monthly, while NRR and CAC-related metrics are generally reviewed monthly to quarterly.
For businesses where renewals are concentrated around quarterly or annual contract cycles, it is also useful to pay particular attention to periods when churn and renewals tend to be concentrated.
Next Article
Financial Insights | Industry KPI Guide Series Vol. 6