


Financial Insights | Industry KPI Guide Series Vol. 9
The bottom line:
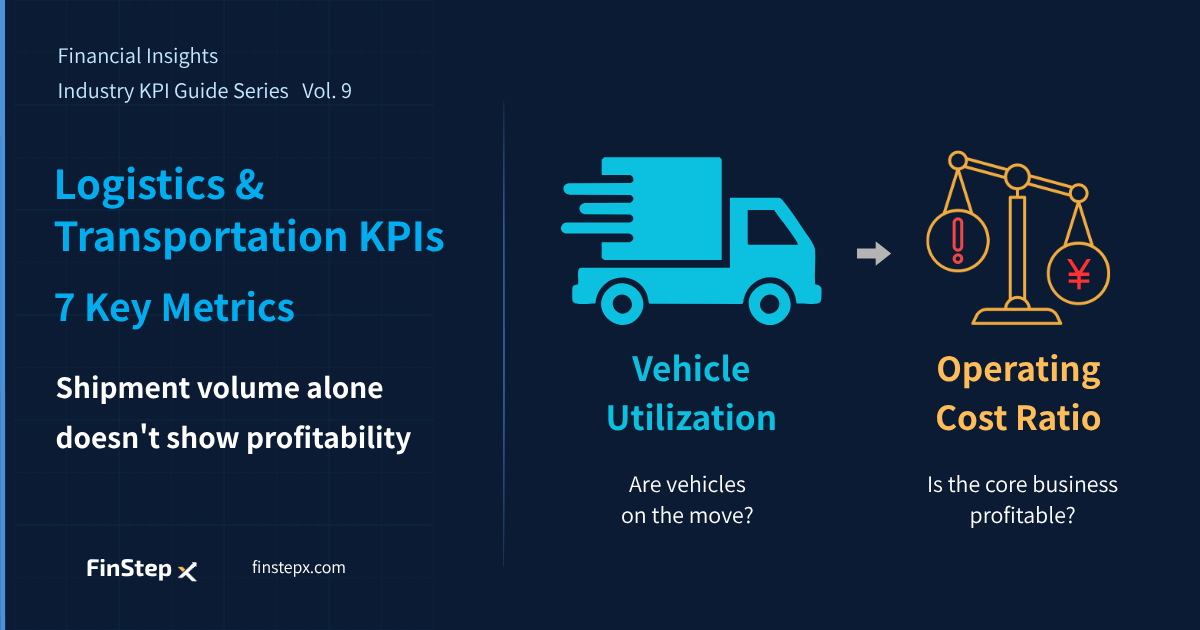
When assessing the performance of a logistics or transportation business, two KPIs should be at the top of the list: Vehicle Utilization and the Operating Cost Ratio.
As labor and fuel costs continue to rise, profitability increasingly depends on how efficiently a company uses its two key resources: its vehicles and its drivers.
Vehicle Utilization shows how effectively the fleet is being used, while the Operating Cost Ratio shows whether that level of activity is translating into a profitable operation.
Starting with these two metrics and then looking deeper into loaded mileage ratio, load factor, fuel cost ratio, and labor cost ratio can help you understand the health of a transportation business from its day-to-day operations all the way through to its financial results.
This article focuses primarily on truck transportation businesses within the broader logistics and transportation industry.
Why Shipment Volume Alone Does Not Tell You How a Transportation Business Is Performing
Logistics and transportation is both an asset-intensive and labor-intensive industry, relying heavily on two resources: vehicles as fixed assets and drivers as human resources.
In recent years, the industry has faced a growing shortage of drivers. In Japan, the limits on overtime work for truck drivers came into effect in April 2024 as part of what is commonly known as the “2024 logistics problem.” This has made securing drivers more difficult and has increased labor costs. At the same time, rising fuel prices have put additional pressure on profitability.
As a result, profits can decline even when shipment volumes remain unchanged.
Vehicles incur fixed costs such as depreciation and lease payments even when they are not on the road. Driver-related labor costs also continue regardless of whether every vehicle is operating at full capacity.
If management looks only at shipment volume or revenue, it can easily miss changes in the underlying cost structure and operational inefficiencies.
The Logistics & Transportation Lifecycle and Its KPIs
The profitability of a transportation business is built through a lifecycle:
Dispatch & Utilization ➜ Transportation Efficiency ➜ Cost Management ➜ Profitability
The process starts with receiving an order and assigning a vehicle, followed by loading and transporting the cargo. Fuel and labor costs are then managed, and the resulting profitability is reflected in the operating results.
These KPIs are not independent of one another, but are closely connected. A problem at one stage affects the next.
Low vehicle utilization ➜ Lower transportation efficiency ➜ Higher fuel and labor costs ➜ Lower profitability
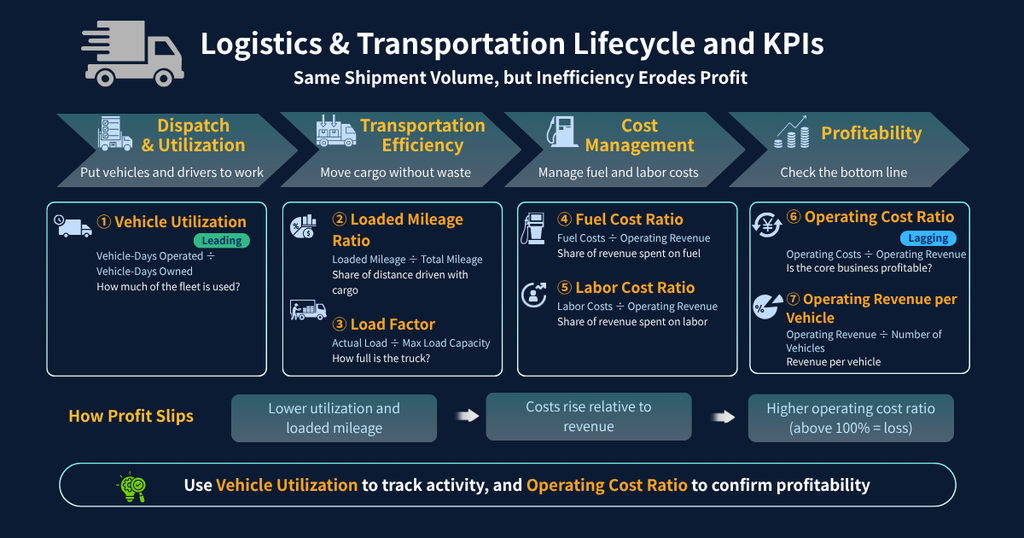
7 Key KPIs for Logistics & Transportation Industry
| Phase | KPI | Formula | What to Look For* |
| Dispatch & Utilization | Vehicle Utilization | Total Vehicle-Days Operated ÷ Total Vehicle-Days Owned | 85% or higher |
| Transportation Efficiency | Loaded Mileage Ratio | Loaded Mileage ÷ Total Mileage | About 70% |
| Transportation Efficiency | Load Factor | Actual Load ÷ Maximum Load Capacity | Varies by business |
| Cost Management | Fuel Cost Ratio | Fuel Costs ÷ Operating Revenue | About 10–15% |
| Cost Management | Labor Cost Ratio | Labor Costs ÷ Operating Revenue | About 40–50% |
| Profitability | Operating Cost Ratio | Operating Costs ÷ Operating Revenue | >98%: Caution >100%: Operating loss |
| Profitability | Operating Revenue per Vehicle | Operating Revenue ÷ Number of Vehicles | Varies by business |
① Vehicle Utilization | How Much of the Fleet Is Actually in Operation?
Vehicle Utilization = Total Vehicle-Days Operated ÷ Total Vehicle-Days OwnedThis measures the percentage of the fleet that is actually being used.
Some downtime is unavoidable due to inspections, maintenance, driver vacations, and other factors. However, if vehicle utilization continues to decline, it may indicate problems with dispatch planning or fleet scheduling.
② Loaded Mileage Ratio | How Much of the Distance Is Driven With Cargo?
Loaded Mileage Ratio = Loaded Mileage ÷ Total MileageThis measures the percentage of total mileage driven while carrying cargo.
While vehicle utilization tells you whether the vehicle is operating, loaded mileage tells you how efficiently that operating time is being used.
For example, a truck may deliver a load on the outbound trip but return empty. The more often this happens, the lower the loaded mileage ratio becomes.
Improving loaded mileage can directly reduce fuel consumption and other operating costs.
③ Load Factor | How Fully Is the Available Capacity Being Used?
Load Factor = Actual Load ÷ Maximum Load CapacityThis measures how effectively the available cargo capacity is being used on each trip.
A high loaded mileage ratio does not necessarily mean transportation is efficient. If the truck is running with a low load factor, the company may be making frequent trips without fully utilizing its available capacity.
There is often significant room for improvement through consolidated shipments, better load planning, and reviewing vehicle size.
Looking at loaded mileage and load factor together provides a much clearer picture of transportation efficiency.
④ Fuel Cost Ratio | How Much of Revenue Is Being Spent on Fuel?
Fuel Cost Ratio = Fuel Costs ÷ Operating RevenueFuel prices fluctuate with market conditions, so they cannot be fully controlled through internal efforts.
That is precisely why improving transportation efficiency matters.
Increasing loaded mileage and load factor can reduce unnecessary driving and improve fuel efficiency, providing a practical way to keep the fuel cost ratio under control.
⑤ Labor Cost Ratio | How Much of Revenue Goes Toward Labor?
Labor Cost Ratio = Labor Costs ÷ Operating RevenueLabor costs include drivers as well as dispatchers, operations managers, and administrative staff.
Because transportation is highly labor-intensive, labor is typically the largest cost category.
A relatively high labor cost ratio is not necessarily a problem in itself. The key question is whether the company is generating enough revenue from its available workforce.
Improving vehicle utilization and loaded mileage can increase revenue generated by the same workforce, helping to control the labor cost ratio.
⑥ Operating Cost Ratio | Is the Core Business Profitable?
Operating Cost Ratio = Operating Costs ÷ Operating RevenueThis is a comprehensive measure of how much it costs to generate operating revenue.
An operating cost ratio above 100% means that operating costs exceed operating revenue, resulting in an operating loss.
By looking at how loaded mileage, load factor, fuel cost ratio, and labor cost ratio are changing, management can see how operational and cost issues are ultimately affecting profitability.
A ratio below 100% means the business is generating an operating profit, while a ratio above 100% means operating costs exceed operating revenue, resulting in an operating loss.
⑦ Operating Revenue per Vehicle | How Much Revenue Does Each Vehicle Generate?
Operating Revenue per Vehicle = Operating Revenue ÷ Number of VehiclesThis productivity metric shows how effectively the company’s vehicle fleet is being converted into revenue.
Adding more vehicles may increase total revenue, but if revenue per vehicle is declining, it may be a sign that fleet expansion is outpacing actual demand or utilization.
The operating cost ratio measures the balance between revenue and costs, while operating revenue per vehicle focuses on asset productivity. The two metrics therefore complement each other.
Warning Signals: Reading Business Risks Through KPI Changes
| KPI | Warning Signal | Business Risks | First Action |
| Vehicle Utilization | Below 85%, or Declines for 3 consecutive months | Fixed costs of idle vehicles squeeze profit | Review dispatch planning and driver schedules. Check inspection and maintenance timing. |
| Loaded Mileage Ratio | Down by 5 percentage points or more YoY | Empty return trips increase fuel and labor costs | Identify routes with frequent empty runs and secure return-trip loads. |
| Load Factor | Remains significantly below the industry average | Low efficiency per trip | Review load consolidation and loading plans. Consider mixed loads and vehicle-size optimization. |
| Fuel Cost Ratio | Rises by 2 percentage points or more YoY | Pressure on profitability | Determine whether the cause is market-driven or inefficient operations. If market-driven, negotiate fuel surcharges or freight-rate adjustments. |
| Labor Cost Ratio | Above 55%, or rises sharply YoY | The largest cost category is increasing | Review together with vehicle utilization and loaded mileage. Consider improving utilization before adding staff. |
| Operating Cost Ratio | >98%: Caution >100%: Operating loss | Core business is unprofitable | Identify the main drivers among the five KPIs above and address the most significant contributors first. |
| Operating Revenue per Vehicle | Declines YoY for 3 consecutive months | Fleet expansion is outpacing utilization | Review the balance between fleet size and utilization and reconsider the investment plan. |
How to Conduct a KPI Review
Step 1: Start with the results
Start with operating revenue and the operating cost ratio. Compare the current month with the previous month and the same month last year to understand where the business stands.
Step 2: Identify the drivers
Review trends in vehicle utilization, loaded mileage, and load factor to explain what is driving changes in profitability.
Step 3: Review costs and productivity
Look at fuel cost ratio, labor cost ratio, and operating revenue per vehicle to identify risks from rising costs or declining productivity.
Step 4: Decide on actions
Turn the findings into specific actions, such as reviewing delivery routes or exploring consolidated shipments. Make it clear who will do what and by when.
Summary
Looking only at shipment volume, a lagging indicator, can hide problems such as empty return trips, declining load efficiency, and an unfavorable cost structure.
By reviewing KPIs across each stage of the transportation lifecycle, management can assess the health of the business from both an operational efficiency and a profitability perspective.
Here is a summary of the seven KPIs covered in this article:
| Phase | KPI | Key Points to Check | Business Impact |
| Dispatch & Utilization | Vehicle Utilization | Are vehicles and drivers being utilized effectively? | Lost revenue opportunities |
| Transportation Efficiency | Loaded Mileage Ratio | Are empty return trips occurring too frequently? | Impact on fuel costs |
| Transportation Efficiency | Load Factor | Is available cargo capacity being used effectively? | Profitability per trip |
| Cost Management | Fuel Cost Ratio | Is cost increase driven by market conditions or operational inefficiency? | Pressure on profitability |
| Cost Management | Labor Cost Ratio | Is labor cost appropriate for the revenue generated? | Largest cost category |
| Profitability | Operating Cost Ratio | Is the business operating profitably? | Profit vs. loss threshold |
| Profitability | Operating Revenue per Vehicle | Is productivity per vehicle at an appropriate level? | Basis for fleet investment decisions |
The purpose of KPI management in logistics and transportation is to identify where operational efficiency is being lost and maximize revenue and profitability from a limited number of vehicles and drivers.
Frequently Asked Questions
1. What is the most important KPI in logistics and transportation?
Vehicle utilization and the operating cost ratio are two of the most important KPIs.
Vehicle utilization is a leading indicator that can be improved on a daily or weekly basis, while the operating cost ratio is a lagging indicator that shows the financial result of those operational conditions on a monthly basis.
2. Which should we prioritize: loaded mileage or load factor?
Neither should be considered in isolation. Both should be monitored together.
A high loaded mileage ratio with a low load factor means the company is making trips without using available capacity efficiently. Conversely, a high load factor with a low loaded mileage ratio indicates losses from empty return trips.
3. What should we check first when fuel costs increase?
First, separate market-driven increases from operational inefficiency.
If fuel prices have risen because of market conditions, the company may need to negotiate freight-rate adjustments or fuel surcharges. If the increase is caused by lower loaded mileage or load factor, the focus should be on improving dispatch planning and shipment consolidation.
4. Is a high labor cost ratio a problem?
Not necessarily.
Labor costs tend to be relatively high in transportation because of the industry’s labor-intensive nature. Rather than judging the labor cost ratio on its own, evaluate it together with vehicle utilization and loaded mileage to determine whether the workforce is being used productively.
5. How often should transportation KPIs be reviewed?
A practical review cycle is:
• Vehicle utilization: Daily to weekly
• Loaded mileage and load factor: Weekly
• Fuel cost ratio, labor cost ratio, and operating cost ratio: Monthly
The key is to establish a consistent review process that allows operational issues to be identified before they appear in monthly financial results.
Next Article
Financial Insights | Industry KPI Guide Series Vol. 10
Industry KPIs Summary: Key Metrics Across 8 Industries and 3 Shared Perspectives