


Financial Analytics & Automation / Power BI KPI Dashboard Creation Series
Introduction
In Vol.5, we created four basic KPI measures: Operating Margin, Utilization Rate, Inventory Turnover, and Defect Rate.
In this article, we will create DAX measures for year-over-year (YoY) changes and target achievement to display in the Card visuals on our dashboard.
Step 1: Calculate Year-over-Year (YoY) Changes
A year-over-year (YoY) comparison measures the difference between the current value and the value for the same period in the previous year.
For rate‑based metrics such as operating margin, utilization rate, and defect rate, the change is expressed as a difference in percentage points (pt). For inventory turnover (number of turns), the change is expressed as a percentage (%).
Power BI provides time intelligence functions that make it easier to retrieve values for previous periods. In this article, we will use SAMEPERIODLASTYEAR.
1. Operating Margin YoY
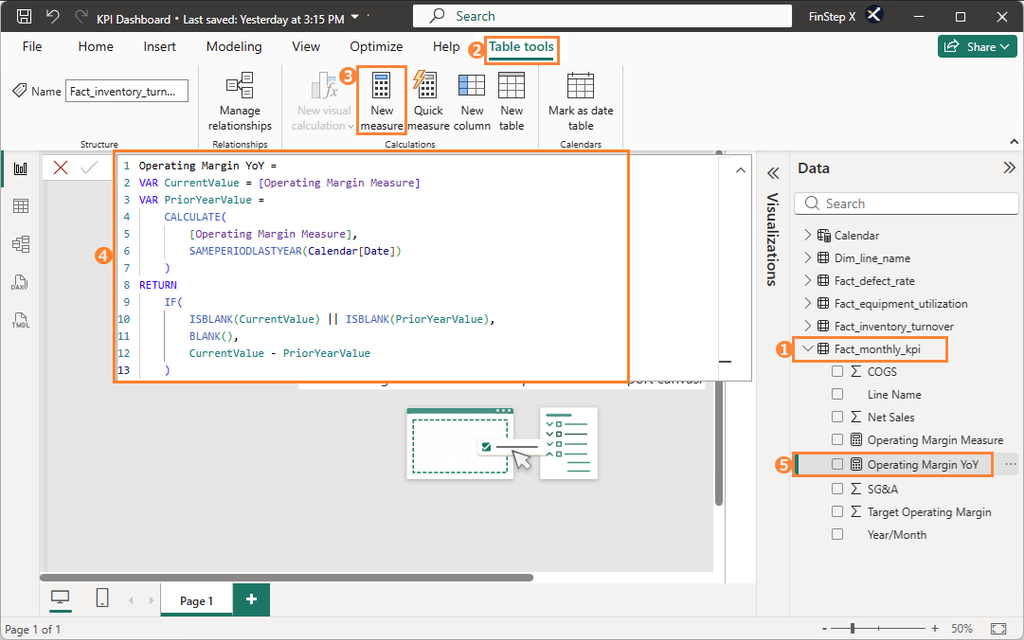
Select the Fact_monthly_kpi table and copy the following DAX formula into the formula bar, and press “Enter”.
Operating Margin YoY =
VAR CurrentValue = [Operating Margin Measure]
VAR PriorYearValue =
    CALCULATE(
        [Operating Margin Measure],
        SAMEPERIODLASTYEAR(Calendar[Date])
    )
RETURN
    IF(
        ISBLANK(CurrentValue) || ISBLANK(PriorYearValue),
        BLANK(),
        CurrentValue - PriorYearValue
    )
Here is what each part of the DAX expression does:
- VAR — assigns a name to an intermediate calculation so it can be referenced later in the measure
- CurrentValue — the Operating Margin for the currently selected period
- PriorYearValue — the Operating Margin for the same period in the previous year, retrieved using
SAMEPERIODLASTYEAR - CALCULATE — changes the filter context to the previous-year period and recalculates the measure
- RETURN — returns the difference between the current value and the prior-year value
2. Utilization Rate YoY
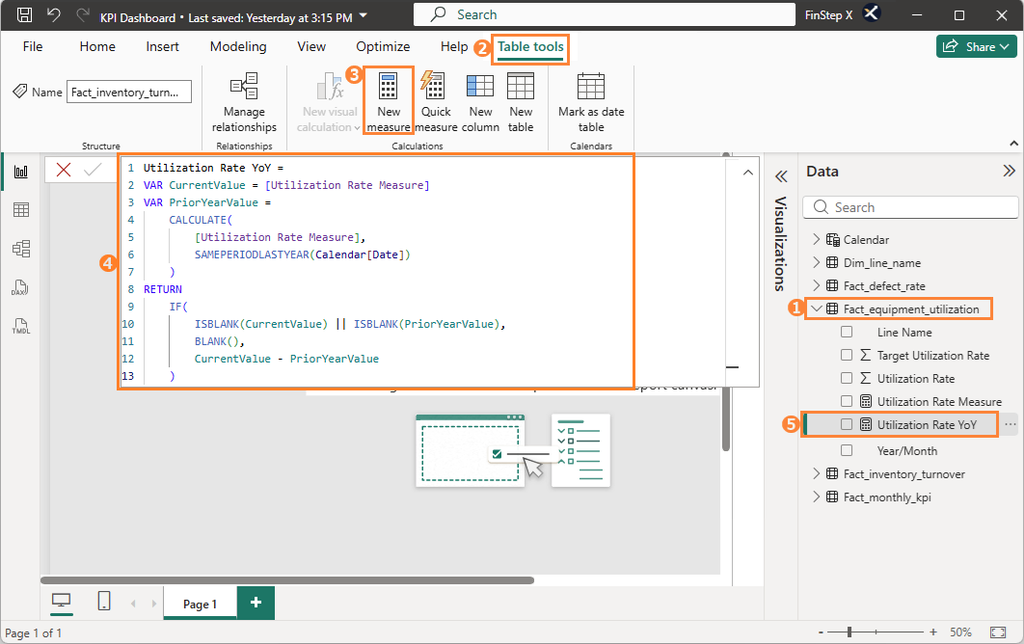
Select the Fact_equipment_utilization table, copy the following DAX formula into the formula bar, and press “Enter”.
Utilization Rate YoY =
VAR CurrentValue = [Utilization Rate Measure]
VAR PriorYearValue =
    CALCULATE(
        [Utilization Rate Measure],
        SAMEPERIODLASTYEAR(Calendar[Date])
    )
RETURN
    IF(
        ISBLANK(CurrentValue) || ISBLANK(PriorYearValue),
        BLANK(),
        CurrentValue - PriorYearValue
    )
3. Inventory Turnover YoY
Inventory Turnover is expressed as a number of turns, so in this example we calculate the year-over-year percentage change using the DIVIDE function.
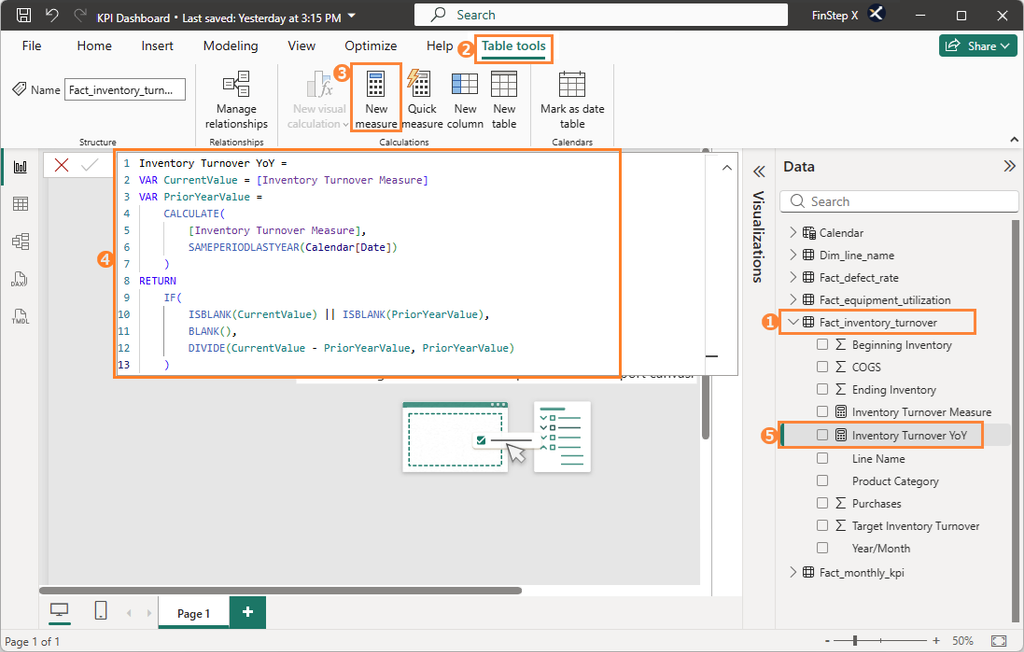
Select the Fact_inventory_turnover table, copy the following DAX formula into the formula bar, and press “Enter”.
Inventory Turnover YoY =
VAR CurrentValue = [Inventory Turnover Measure]
VAR PriorYearValue =
    CALCULATE(
        [Inventory Turnover Measure],
        SAMEPERIODLASTYEAR(Calendar[Date])
    )
RETURN
    DIVIDE(
        CurrentValue - PriorYearValue,
        PriorYearValue
    )
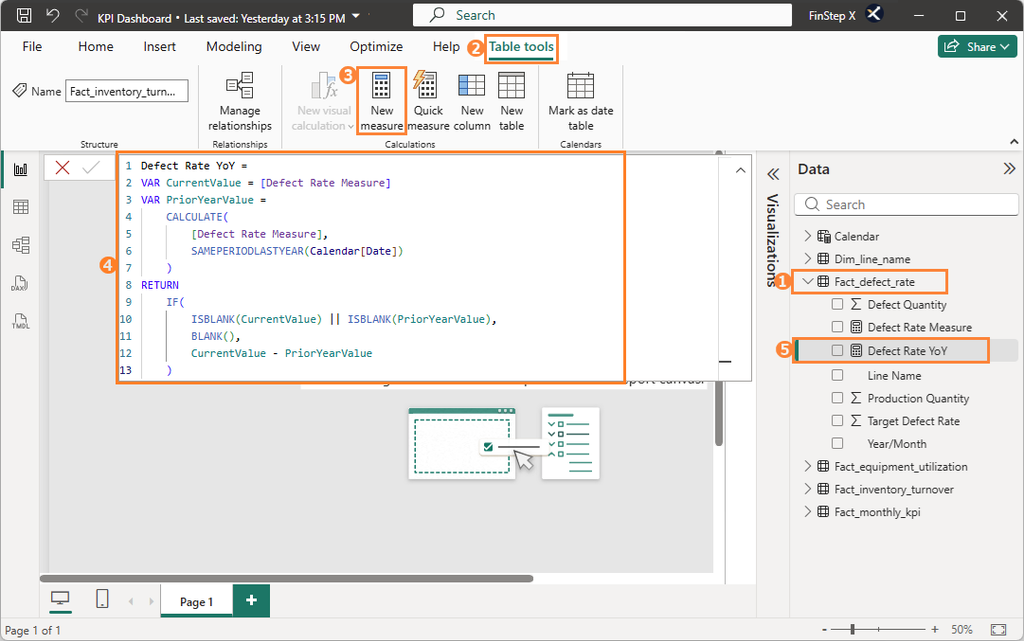
4. Defect Rate YoY
Select the Fact_defect_rate table, copy the following DAX formula into the formula bar, and press “Enter”.
Defect Rate YoY =
VAR CurrentValue = [Defect Rate Measure]
VAR PriorYearValue =
    CALCULATE(
        [Defect Rate Measure],
        SAMEPERIODLASTYEAR(Calendar[Date])
    )
RETURN
    IF(
        ISBLANK(CurrentValue) || ISBLANK(PriorYearValue),
        BLANK(),
        CurrentValue - PriorYearValue
    )
Step 2: Format YoY Values as Readable Text
The YoY measures created in Step 1 return numeric values. To make the year-over-year results easier to read in card visuals, we’ll create a YoY Text measure for each KPI in the next step.
- Operating Margin, Utilization Rate, and Defect Rate → percentage-point change such as
+1.2 pt - Inventory Turnover → percentage change such as
+3.4% - When no prior-year data is available → “No prior year data”
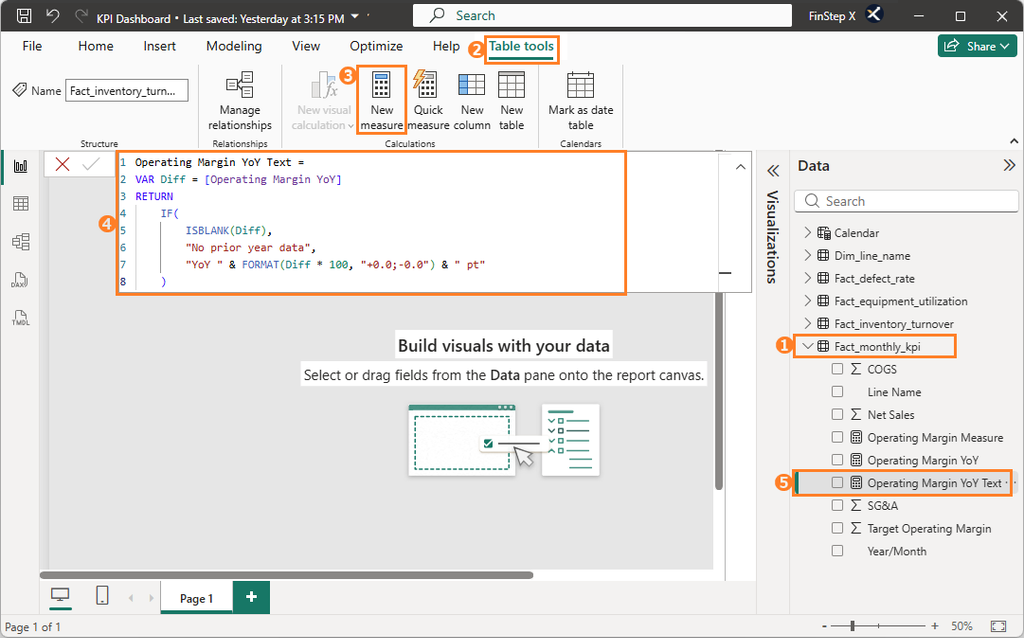
1. Operating Margin YoY Text
Select the Fact_monthly_kpi table, copy the following DAX formula into the formula bar, and press “Enter”.
Operating Margin YoY Text =
VAR Diff = [Operating Margin YoY]
RETURN
    IF(
        ISBLANK(Diff),
        "No prior year data",
        "YoY " & FORMAT(Diff * 100, "+0.0;-0.0") & " pt"
    )
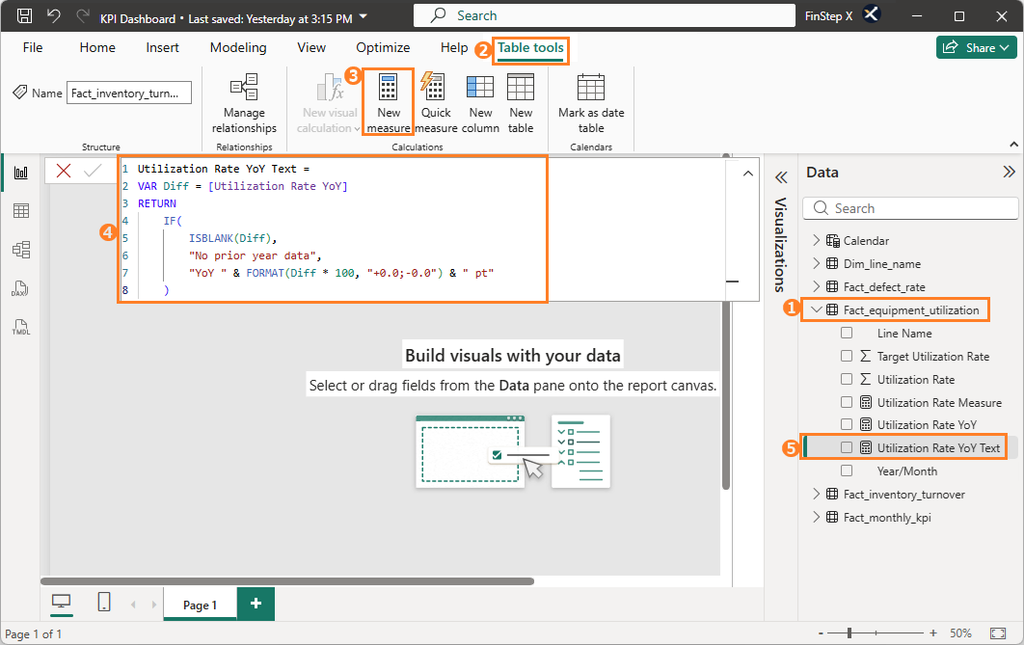
2. Utilization Rate YoY Text
Select the Fact_equipment_utilization table, copy the following DAX formula into the formula bar, and press “Enter”.
Utilization Rate YoY Text =
VAR Diff = [Utilization Rate YoY]
RETURN
    IF(
        ISBLANK(Diff),
        "No prior year data",
        "YoY " & FORMAT(Diff * 100, "+0.0;-0.0") & " pt"
    )
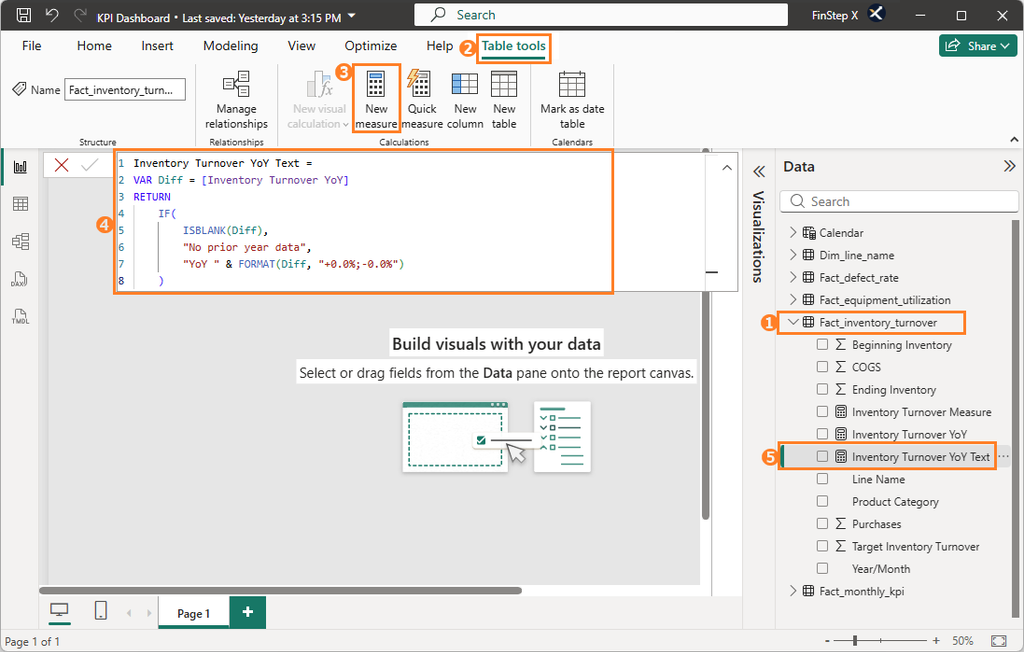
3. Inventory Turnover YoY Text
Select the Fact_inventory_turnover table, copy the following DAX formula into the formula bar, and press “Enter”.
Inventory Turnover YoY Text =
VAR Diff = [Inventory Turnover YoY]
RETURN
    IF(
        ISBLANK(Diff),
        "No prior year data",
        "YoY " & FORMAT(Diff, "+0.0%;-0.0%")
    )
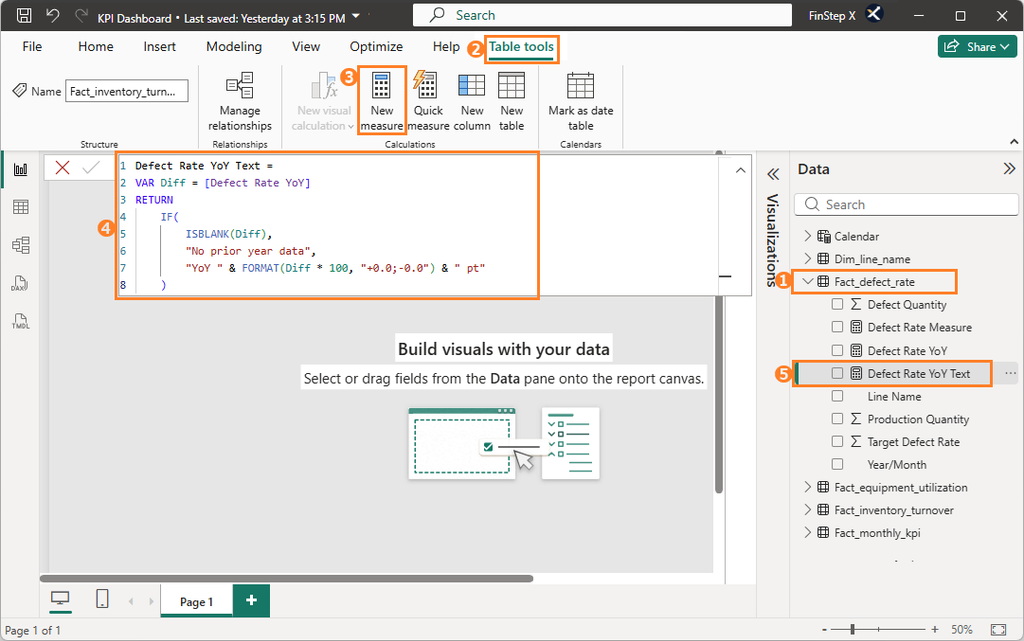
4. Defect Rate YoY Text
Select the Fact_defect_rate table, copy the following DAX formula into the formula bar, and press “Enter”.
A lower Defect Rate is better, so a negative YoY change represents an improvement.
Defect Rate YoY Text =
VAR Diff = [Defect Rate YoY]
RETURN
    IF(
        ISBLANK(Diff),
        "No prior year data",
        "YoY " & FORMAT(Diff * 100, "+0.0;-0.0") & " pt"
    )
Step 3: Determine Whether Each KPI Has Met Its Target
Finally, create a measure that determines whether each KPI has met its target and displays the result like this:
Target: 12.0%; ✓ AchievedTarget: 8.5%; Not Achieved
The sample dataset includes a Target value for each KPI. Although targets are defined by production line and year, we’ll keep the DAX simple by using AVERAGE to combine the selected target values into a single value.
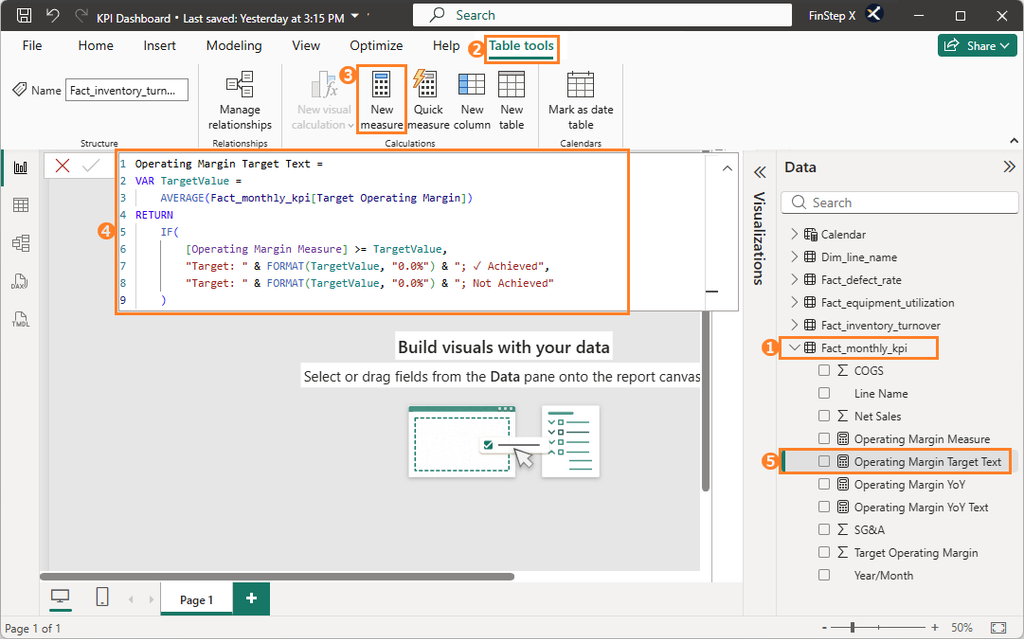
1. Operating Margin Target Text
Select the Fact_monthly_kpi table, copy the following DAX formula into the formula bar, and press “Enter”.
Operating Margin Target Text =
VAR TargetValue =
    AVERAGE(Fact_monthly_kpi[Target Operating Margin])
RETURN
    IF(
        [Operating Margin Measure] >= TargetValue,
        "Target: " & FORMAT(TargetValue, "0.0%") & "; ✓ Achieved",
        "Target: " & FORMAT(TargetValue, "0.0%") & "; Not Achieved"
    )
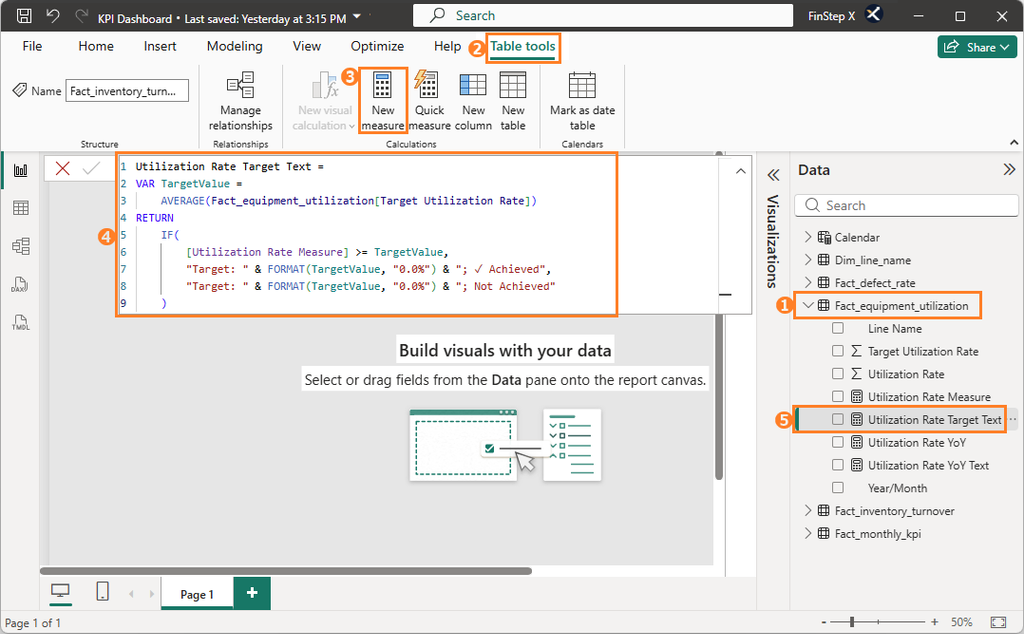
2. Utilization Rate Target Text
Select the Fact_equipment_utilization table, copy the following DAX formula into the formula bar, and press “Enter”.
Utilization Rate Target Text =
VAR TargetValue =
    AVERAGE(Fact_equipment_utilization[Target Utilization Rate])
RETURN
    IF(
        [Utilization Rate Measure] >= TargetValue,
        "Target: " & FORMAT(TargetValue, "0.0%") & "; ✓ Achieved",
        "Target: " & FORMAT(TargetValue, "0.0%") & "; Not Achieved"
    )
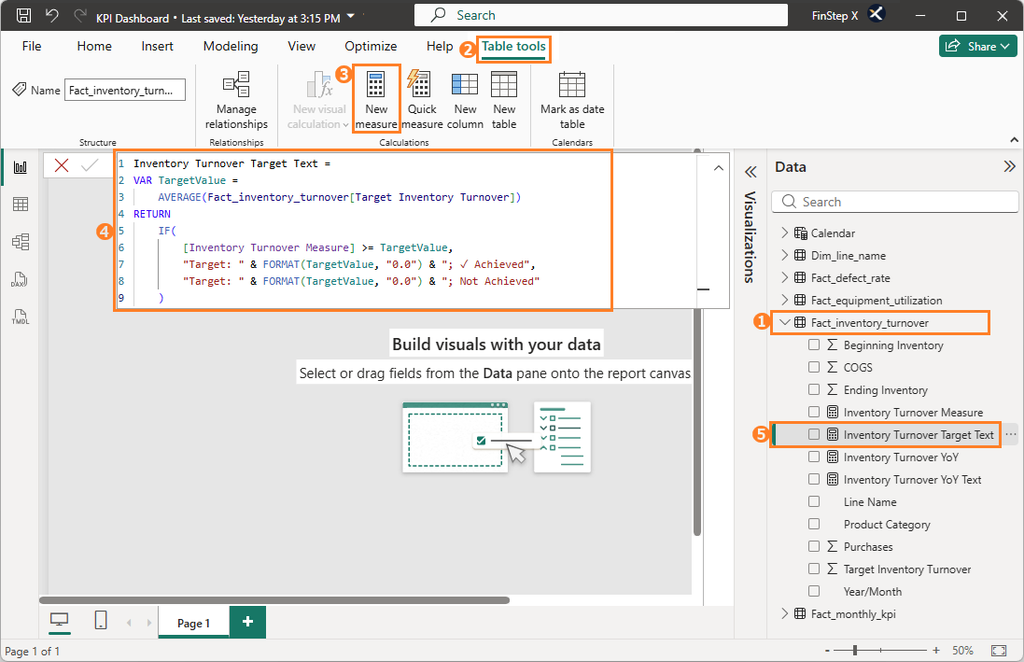
3. Inventory Turnover Target Text
Select the Fact_inventory_turnover table, copy the following DAX formula into the formula bar, and press “Enter”.
Inventory Turnover Target Text =
VAR TargetValue =
    AVERAGE(Fact_inventory_turnover[Target Inventory Turnover])
RETURN
    IF(
        [Inventory Turnover Measure] >= TargetValue,
        "Target: " & FORMAT(TargetValue, "0.0") & "; ✓ Achieved",
        "Target: " & FORMAT(TargetValue, "0.0") & "; Not Achieved"
    )
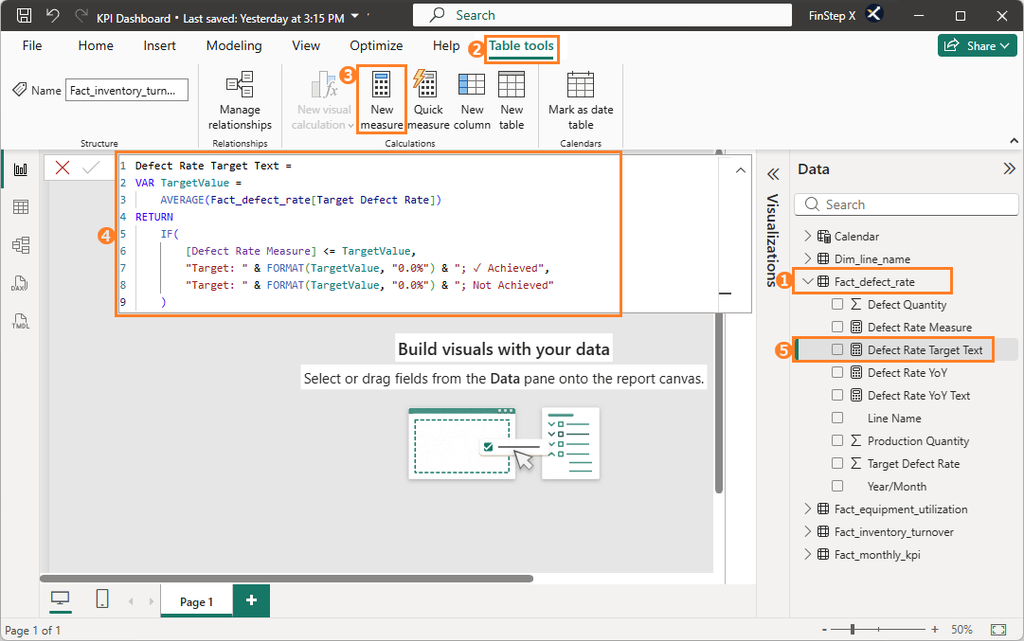
4. Defect Rate Target Text
Select the Fact_defect_rate table, copy the following DAX formula into the formula bar, and press “Enter”.
Defect Rate is a metric where lower is better, so the target comparison is reversed.
Defect Rate Target Text =
VAR TargetValue =
    AVERAGE(Fact_defect_rate[Target Defect Rate])
RETURN
    IF(
        [Defect Rate Measure] <= TargetValue,
        "Target: " & FORMAT(TargetValue, "0.0%") & "; ✓ Achieved",
        "Target: " & FORMAT(TargetValue, "0.0%") & "; Not Achieved"
    )
Step 4: Save the File
Once you have finished creating the measures, press Ctrl + S to save the file.
Summary
In this article, we used the four basic measures created in Vol. 5 to create measures for year-over-year (YoY) changes and target achievement.
| Measure Type | Key DAX Functions |
|---|---|
| YoY | SAMEPERIODLASTYEAR, CALCULATE |
| YoY Text | IF, FORMAT |
| Target Text | IF, AVERAGE, FORMAT |
The key DAX measures needed for the dashboard’s Card visuals are now ready.
Frequently Asked Questions (FAQ)
1. What is Time Intelligence?
It is a framework for calculating year-over-year changes, month-over-month changes, cumulative totals, and more, based on dates.
2. When should I use SAMEPERIODLASTYEAR?
Use SAMEPERIODLASTYEAR when you want to retrieve the value for the same period in the previous year based on the current date context.
3. How does VAR work, and what are its benefits?
VAR allows you to assign a name to an intermediate calculation and reuse it later in the same DAX expression.
This makes complex DAX expressions easier to read, understand, and maintain.
4. What is the FORMAT function used for?
The FORMAT function converts a value into text using a specified format.
In this article, we use it to display numeric results as readable text, such as +1.2 pt or +3.4%.
5. How do I use the CALCULATE function?
It modifies the filter context and recalculates an existing measure.
What’s Next?
In Vol. 7, we will place the measures created in this article into Card and chart visuals and build the dashboard using slicers to interactively filter the results.