


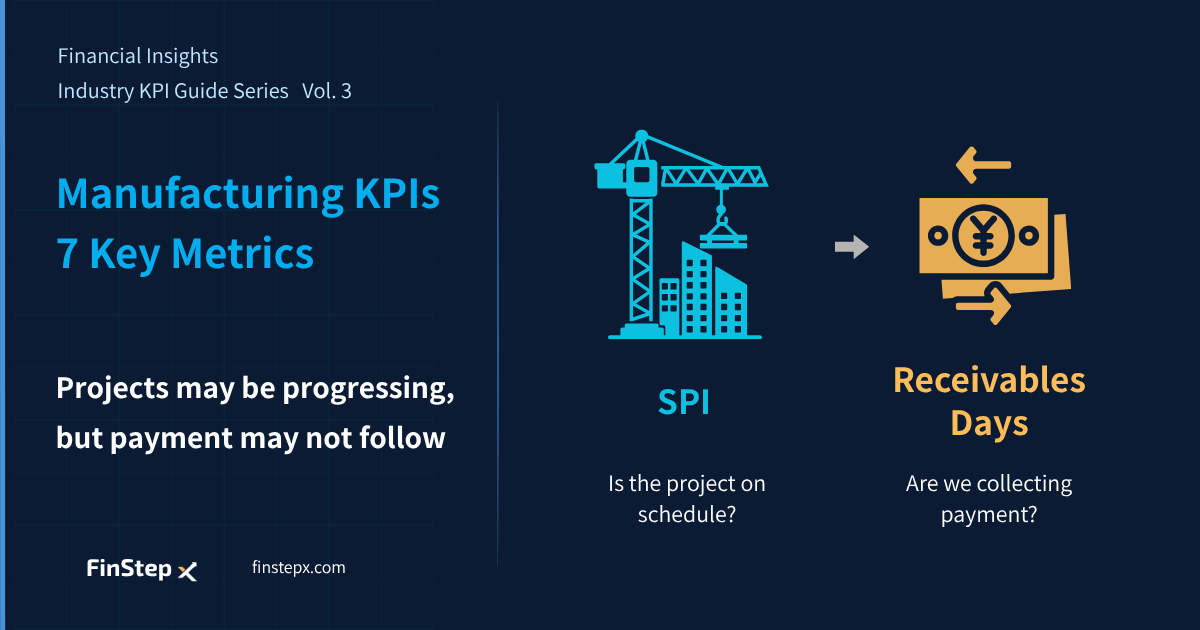
Financial Insights | Industry KPI Guide Series Vol. 3
The bottom line:
The two KPIs construction companies should look at first are SPI (Schedule Performance Index) and Construction Receivables Days.
Delays and cost overruns often show up as deteriorating profitability only toward the end of a project, making it difficult to spot problems early. SPI is one of the earliest indicators of whether a project is starting to fall behind schedule.
At the same time, even after a project is completed and an invoice has been issued, cash flow does not improve until the money is actually collected. Construction Receivables Days shows how long the proceeds from completed projects remain outstanding.
Use SPI to identify problems with project progress early, and Construction Receivables Days to see whether cash is getting tied up in receivables. Looking at these two KPIs together helps reveal where the gap between profit and cash is coming from — the classic situation where a company is profitable on paper but short of cash.
Why Can Construction Companies Be “Profitable but Short on Cash”?
Unlike manufacturing, where the same products are produced repeatedly, construction companies complete projects that differ from one another, often over periods ranging from several months to several years.
In construction, the final profitability of a project is not fully determined until the project is completed. Even when revenue is recognized based on progress, delays in updating estimated costs can mean that cost overruns do not become visible in the financial statements until the latter stages of the project or even at completion.
Cash outflows also tend to come first. Materials, subcontractor costs, and other project expenses may need to be paid before the related construction revenue is collected, which may happen at completion or according to the project’s progress.
This structure is not unique to construction, but the large project values and long project cycles make delayed collections particularly significant for cash flow.
The Construction Industry Lifecycle
The construction lifecycle can be viewed as a sequence of four stages:
Orders & Estimation ➜ Construction ➜ Completion & Handover ➜ Collection
A problem at one stage inevitably affects the next. One of the key roles of management control is to identify these knock-on effects early and stop the chain reaction before it spreads.
Construction delays ➜ Longer project duration ➜ Cost overruns ➜ Lower margins ➜ Delayed inspection & billing ➜ Cash flow pressure
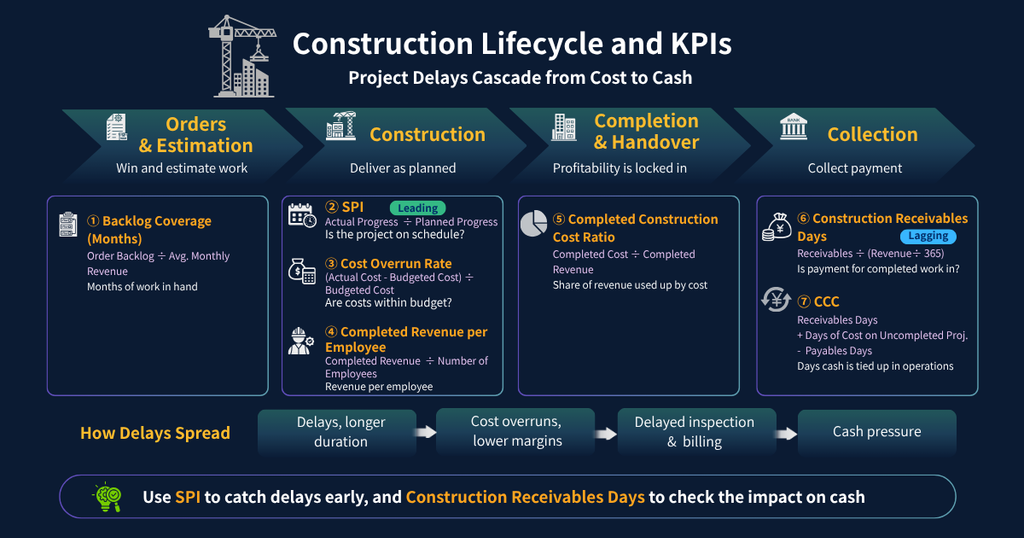
7 Key KPIs for the Construction Industry
| Phase | KPI | Formula | What to Look For* |
| Orders & Estimation | Backlog Coverage (Months) | Order Backlog ÷ Average Monthly Revenue from Completed Construction | Months of revenue the backlog represents |
| Construction | SPI (Schedule Performance Index) | Actual Progress % ÷ Planned Progress % | 100%: on schedule; <100%: behind schedule |
| Construction | Cost Overrun Rate | (Actual Cost − Budgeted Cost) ÷ Budgeted Cost | 0%: on budget; monitor the size of the overrun |
| Construction | Revenue per Employee | Revenue from Completed Construction ÷ Number of Employees | YoY trend and peer comparison |
| Completion & Handover | Completed Construction Cost Ratio | Completed Construction Cost ÷ Revenue from Completed Construction | Trend within the company by project type |
| Collection | Construction Receivables Days | Construction Receivables ÷ (Revenue from Completed Construction ÷ 365) | Difference from contractual payment terms |
| Collection | CCC (Cash Conversion Cycle) | Construction Receivables Days + Days of Costs on Uncompleted Construction − Construction Payables Days | Difference from your own historical average |
① Backlog Coverage (Months) | Do We Have Enough Work Ahead?
Backlog Coverage (Months) = Order Backlog ÷ Average Monthly Revenue From Completed ConstructionOrder backlog tells you how much work the company already has in hand. Converting that backlog into months gives you a clearer view of how long the current workload can support future revenue.
A decline in Backlog Coverage for three consecutive months should be treated as a warning sign.
If orders are declining while headcount continues to increase, labor costs can become a growing fixed-cost burden. It is useful to establish an appropriate backlog level based on your typical project duration and order cycle.
② SPI | Is the Project Progressing as Planned?
SPI = Actual Progress % ÷ Planned Progress %SPI (Schedule Performance Index) is one of the earliest indicators of whether a construction project is falling behind schedule.
Once SPI starts to deteriorate, it can affect everything that follows — including cost overruns, overtime or accelerated work, higher subcontracting costs, and delayed billing.
In other words, SPI is an early warning signal for the overall health of a construction project.
③ Cost Overrun Rate | Are Costs Exceeding the Budget?
Cost Overrun Rate = (Actual Cost − Budgeted Cost) ÷ Budgeted CostThe Cost Overrun Rate helps identify early signs that a project’s economics are beginning to deteriorate.
The cause matters. An overrun that can be absorbed through a design change is very different from one caused by poor cost control.
If this KPI continues to worsen, it will eventually affect the Completed Construction Cost Ratio and project profitability.
④ Revenue per Employee | Are We Using Our Workforce Efficiently?
Revenue per Employee = Revenue from Completed Construction ÷ Number of EmployeesThis KPI shows how much completed construction revenue is generated per employee.
Simply increasing headcount does not necessarily improve profitability, so this metric should be monitored over time alongside project volume and margins.
⑤ Completed Construction Cost Ratio | Is Project Profitability Now Clear?
Completed Construction Cost Ratio = Completed Construction Cost ÷ Revenue from Completed ConstructionDelays and cost overruns during construction ultimately show up in this ratio.
Once a project is completed, its costs are essentially finalized, leaving little room to improve the economics. That is why identifying problems while the project is still under construction is critical.
⑥ Construction Receivables Days | Are We Getting Paid for Completed Work?
Construction Receivables Days = Construction Receivables ÷ (Revenue from Completed Construction ÷ 365)This KPI shows how long the proceeds from completed construction projects remain uncollected.
The higher the number of days, the longer cash remains tied up outside the company.
⑦ CCC | How Efficiently Is Working Capital Turning Over?
CCC
= Construction Receivables Days + Days of Costs on Uncompleted Construction − Construction Payables Days

Construction Payables Days
= Construction Payables ÷ (Completed Construction Cost ÷ 365)

Days of Costs on Uncompleted Construction
= Costs on Uncompleted Construction ÷ (Completed Construction Cost ÷ 365)
CCC (Cash Conversion Cycle) measures how long it takes for cash to return after the company has paid for materials, subcontracting, and other construction costs.
The shorter the cycle, the less cash the company needs to keep tied up in its operations.
Warning Signals: Reading Business Risks Through KPI Changes
| KPI | Warning Signal | Business Risks | First Action |
|---|---|---|---|
| Backlog Coverage (Months) | Declining for 3 consecutive months | Insufficient future work; higher fixed-cost burden | Strengthen sales efforts and review project priorities |
| SPI | Below 95% | Project delays ➜ higher costs | Identify the cause of the delay and review the schedule |
| Cost Overrun Rate | Above 5% (Above 10%: serious) | Project economics beginning to deteriorate | Review cost controls and assess whether a contract change is needed |
| Revenue per Employee | Declining for 2 consecutive quarters | Lower profitability | Separate the impact of revenue and headcount |
| Completed Construction Cost Ratio | Above your historical average | Lower margins | Review SPI and Cost Overrun Rate during construction |
| Construction Receivables Days | More than 15 days above your average | Cash tied up in receivables | Review inspection and billing processes |
| CCC | More than 30 days above your average | Working capital shortage | Consider milestone billing and reduce costs tied up in uncompleted projects |
How to Review Construction KPIs: Use Two Levels of Management
Construction companies should review KPIs at two levels:
- Project level — managing the profitability of individual projects
- Company-wide monthly review — reviewing overall performance as part of management meetings
1. Project Level (Weekly to Monthly)
Use project ledgers and cost management reports to review SPI and Cost Overrun Rate for each project.
When a project shows an abnormal trend, address it immediately at the project level.
2. Company-wide Monthly Review
Step 1: Start with the results
Review revenue from completed construction projects, gross profit margin on completed construction projects, and operating profit against the previous month and the same month last year.
Step 2: Identify the drivers
Review the SPI and Cost Overrun Rate trends for projects completed during the month and assess their impact on the Completed Construction Cost Ratio.
Step 3: Look ahead
Use Backlog Coverage, Construction Receivables Days, and CCC to identify potential risks in the coming months.
Step 4: Decide on actions
Make it clear who will do what, and by when.
Connecting project-level anomaly detection with company-wide monthly management reviews allows operational data from individual construction sites to feed directly into management decision-making.
Summary
Construction KPIs are interconnected across the entire flow from Orders & Estimation to cash collection.
- Construction delays push up costs.
- Higher costs put pressure on margins.
- Delayed billing puts pressure on cash flow.
That is why KPIs should not be viewed in isolation. The key is to understand where a problem begins and how its impact flows into the next stage of the construction lifecycle.
The seven KPIs covered in this article are:
| Phase | KPI | Key Points to Check | Management Impact |
|---|---|---|---|
| Orders & Estimation | Backlog Coverage (Months) | Is enough future revenue secured? | Future performance |
| Construction | SPI | Is the project progressing as planned? | Schedule and cost |
| Construction | Cost Overrun Rate | Are costs exceeding the budget? | Completed Construction Cost Ratio |
| Construction | Revenue per Employee | Is the workforce used efficiently? | Profitability |
| Completion & Handover | Completed Construction Cost Ratio | Are project costs under control? | Gross profit margin |
| Collection | Construction Receivables Days | Is cash tied up in unpaid project revenue? | Cash flow |
| Collection | CCC | Is working capital turning over efficiently? | Working capital efficiency |
Financial statements show the results of what has already happened.
These KPIs, by contrast, provide different views of project progress, profitability, and cash flow, helping management identify potential changes before they fully appear in the financial results.
The purpose of KPI management in construction is to identify early which project, and which stage of that project, is causing trouble — and prevent the problem from spreading into costs and cash flow.
Frequently Asked Questions
1. What is the most important KPI for a construction company?
SPI and Construction Receivables Days.
SPI shows whether a project is falling behind schedule, while Construction Receivables Days shows how long cash from completed projects remains outstanding.
2. Why do construction delays lead to higher costs?
When a project runs longer than planned, overtime, subcontracting, and site overhead costs can increase.
Accelerated work can also create quality issues and lead to additional rework, further increasing project costs.
3. How can a construction company reduce Construction Receivables Days?
The timing of payment depends heavily on the customer’s contractual terms. However, companies can often shorten the collection cycle by bringing forward inspections, standardizing the billing process, and reducing documentation errors.
A figure more than 15 days above your historical average is a warning sign.
4. Can cost overruns be identified early?
Yes.
Comparing budgeted and actual costs on a weekly basis can help identify problems before the Cost Overrun Rate reaches 5%.
An overrun above 5% should be treated as a warning sign. Once it exceeds 10%, there is a higher possibility that project profitability is already under significant pressure.
5. Which should be prioritized: project-level or company-wide management?
Both are necessary, but project-level management should come first.
Company-wide management consolidates the results of multiple projects and turns them into management decisions. The underlying problems, however, need to be identified at the individual project level.
Next Article
Financial Insights | Industry KPI Guide Series Vol. 4
Retail KPIs: 7 Key Metrics, Starting with Conversion Rate and GMROI