


Financial Analytics & Automation / Power BI KPI Dashboard Creation Series
Introduction
In Vol. 4, we created a Calendar table and connected the four fact tables to both the Calendar master table and the line master table to build the data model.
In this article, we will use the basic DAX functions of SUM, AVERAGE, and DIVIDE to create the DAX measures that form the foundation for calculating KPIs in Power BI.
Step 1: Understanding DAX and Measures
1. What Is DAX?
DAX (Data Analysis Expressions) is a formula language used in Power BI to perform calculations.
Its syntax is similar to Excel formulas, and functions such as SUM, AVERAGE, and DIVIDE can be combined to calculate KPIs. DAX can be used to create calculated columns, measures, and calculated tables, etc.
The Calendar table we created in Vol. 4 was also created using DAX.
2. What Is a Measure?
A measure is a calculation that Power BI evaluates dynamically based on the current filter context in the report, such as the selected period or production line.
For example, if you create a measure that calculates total sales, Power BI automatically recalculates the result whenever you change the selected period or production line using a slicer. All of the KPIs we create in this article will be measures.
Step 2: KPI Measures We Will Create
The fact tables used in this sample store KPI-related data in two different ways.
1. Tables Where the KPI Must Be Calculated from Underlying Data
The following tables do not contain the KPI itself. Instead, they contain the underlying data used to calculate it.
Fact_monthly_kpiFact_inventory_turnoverFact_defect_rate
For ratio-based KPIs such as Operating Margin and Defect Rate, simply averaging the ratios calculated for individual rows can produce an incorrect result.
The correct approach is generally to aggregate the underlying values first and then calculate the ratio. This effectively produces a weighted result based on the underlying quantities.
For example:
| Production Line | Sales (¥10K) | Operating Margin |
|---|---|---|
| Line A | 1,000 | 20% |
| Line B | 100 | 10% |
A simple average of the two operating margins is 15%.
However, because Line A has much higher sales, the correct overall operating margin, calculated from the underlying amounts, is approximately 19%.
2. Tables Where the KPI Is Already Provided at the Row Level
Fact_equipment_utilization
This table already contains the utilization rate for each row.
For this sample, we will calculate the measure using an average, assuming that the available operating time is the same for each production line.
Step 3: Create the KPI Measures
1. Operating Margin
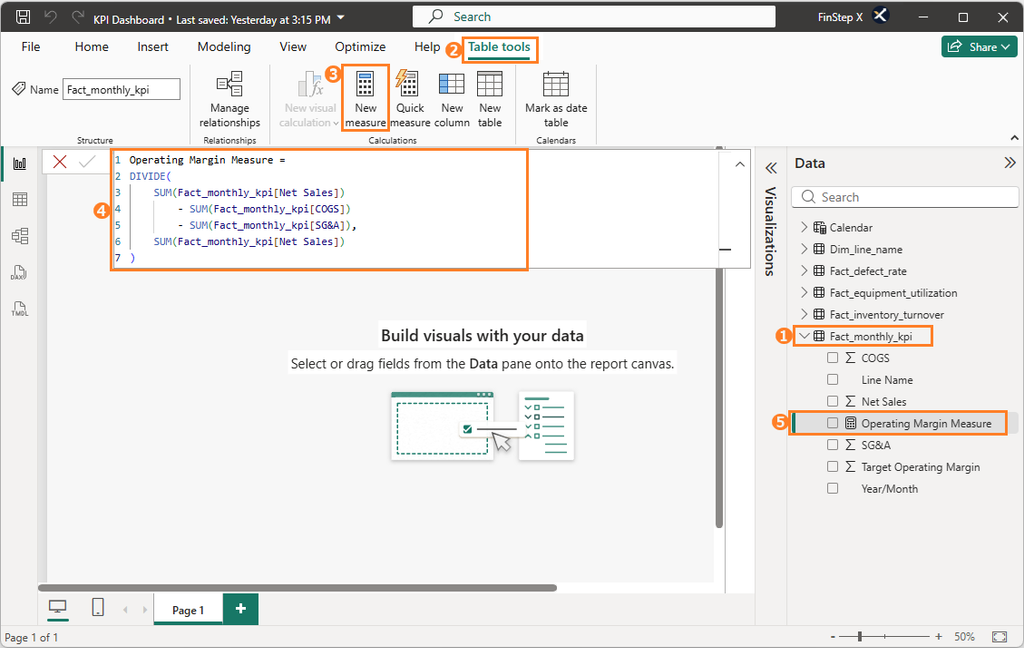
Select the Fact_monthly_kpi table and go to Modeling → New measure.
Enter the following DAX expression in the formula bar and press Enter.
Confirm that Operating Margin Measure has been created in the Data pane on the right.
Operating Margin Measure =
DIVIDE(
    SUM(Fact_monthly_kpi[Net Sales])
        - SUM(Fact_monthly_kpi[COGS])
        - SUM(Fact_monthly_kpi[SG&A]),
    SUM(Fact_monthly_kpi[Net Sales])
)
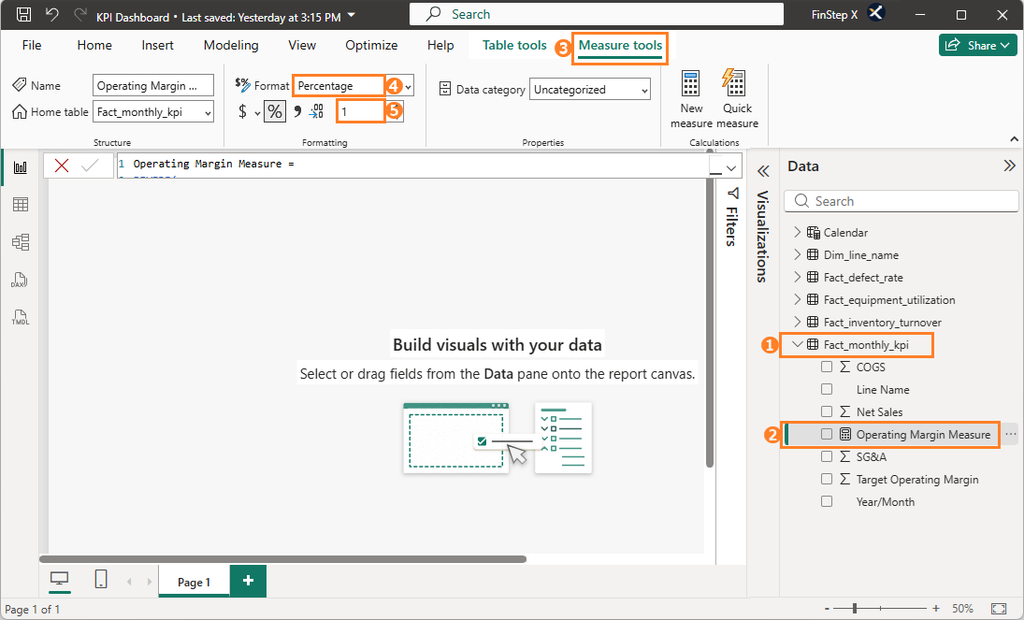
With the measure selected, go to the Measure tools tab and set Format to Percentage. Set the number of decimal places to 1.
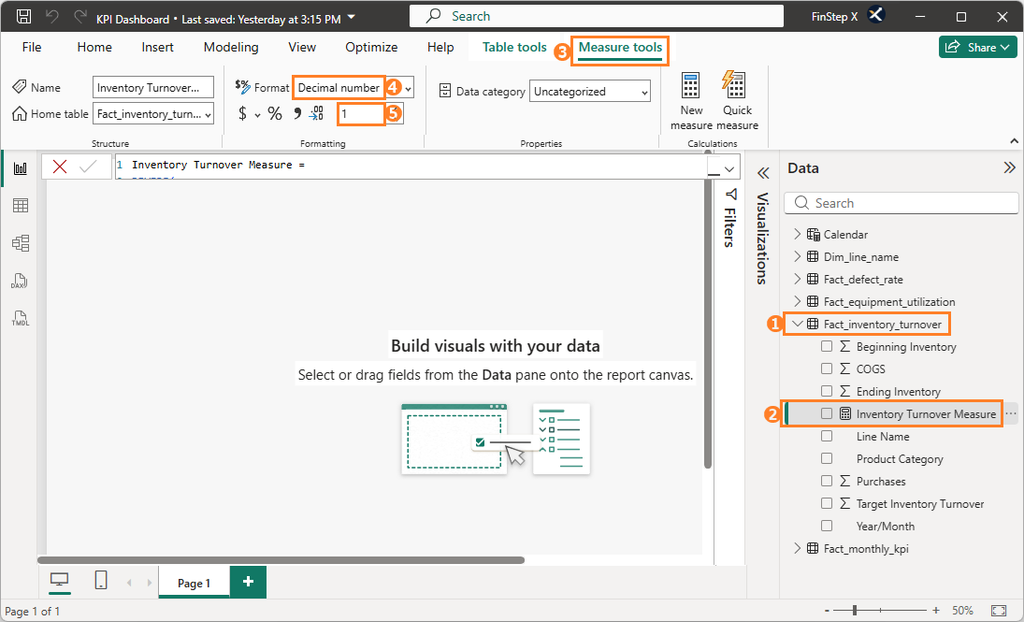
2. Inventory Turnover
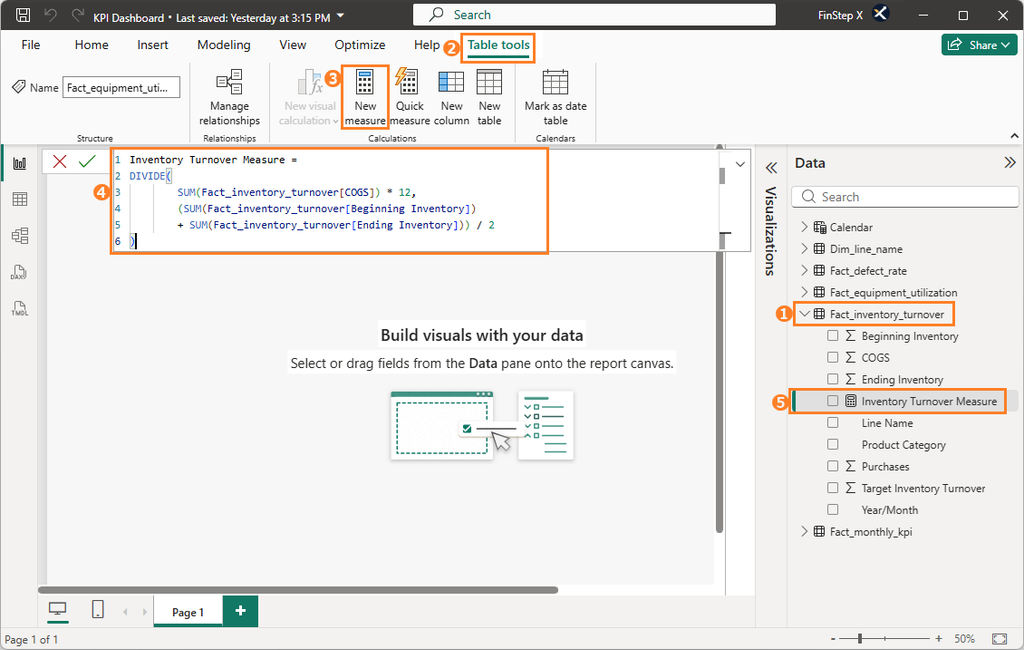
Enter the following DAX expression in the formula bar and press Enter.
Confirm that Inventory Turnover Measure has been created in the Data pane on the right.
Inventory Turnover Measure =
DIVIDE(
    SUM(Fact_inventory_turnover[COGS]) * 12,
    (SUM(Fact_inventory_turnover[Beginning Inventory])
        + SUM(Fact_inventory_turnover[Ending Inventory])) / 2
)
With the measure selected, go to the Measure tools tab and set Format to Decimal number. Set the number of decimal places to 1.
3. Defect Rate
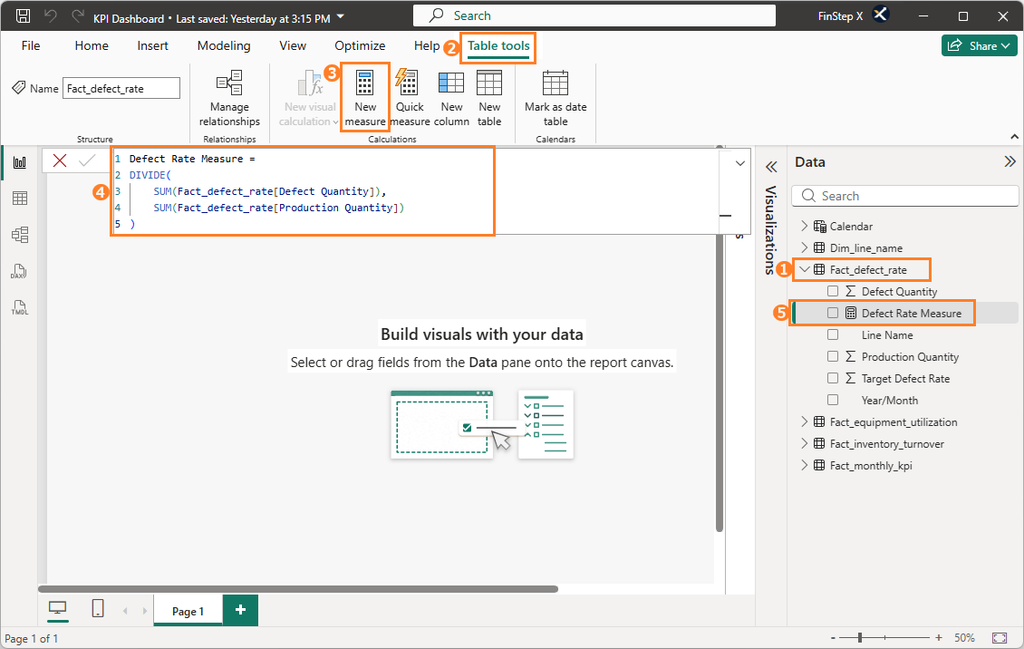
Enter the following DAX expression in the formula bar and press Enter.
Confirm that Defect Rate Measure has been created in the Data pane on the right.
Defect Rate Measure =
DIVIDE(
    SUM(Fact_defect_rate[Defect Quantity]),
    SUM(Fact_defect_rate[Production Quantity])
)
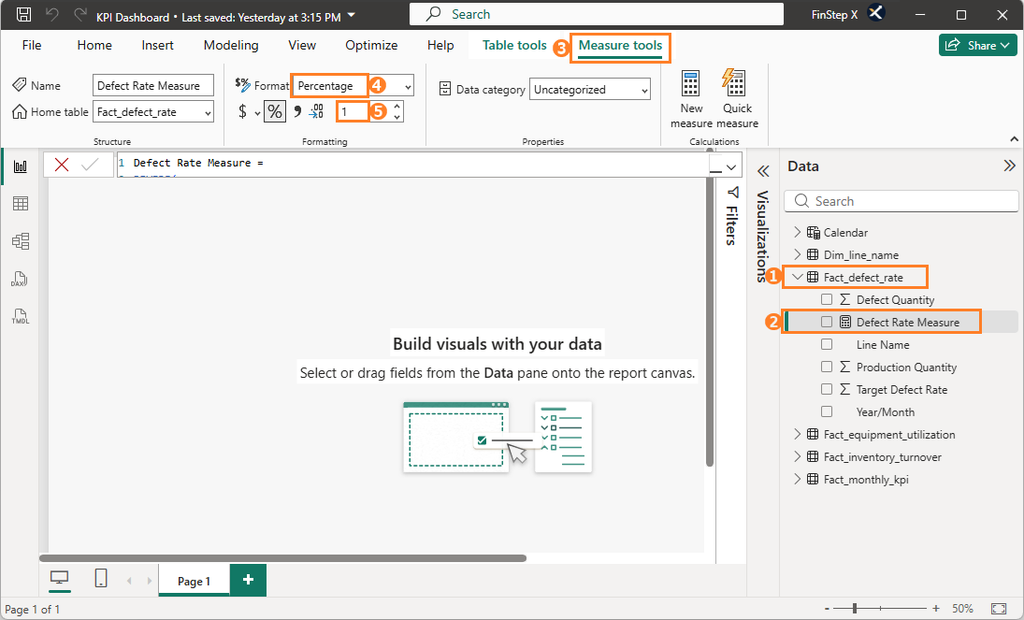
As with Operating Margin, set the Format of the Defect Rate Measure to Percentage and set the number of decimal places to 1.
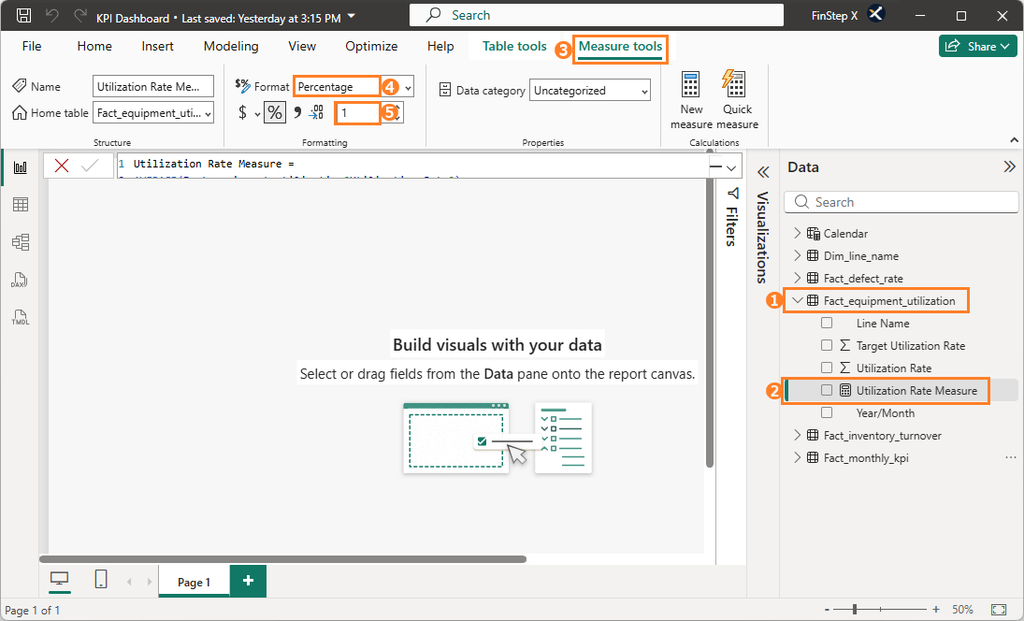
4. Utilization Rate
Enter the following DAX expression in the formula bar and press Enter.
Confirm that Utilization Rate Measure has been created in the Data pane on the right.
Utilization Rate Measure =
AVERAGE(Fact_equipment_utilization[Utilization Rate])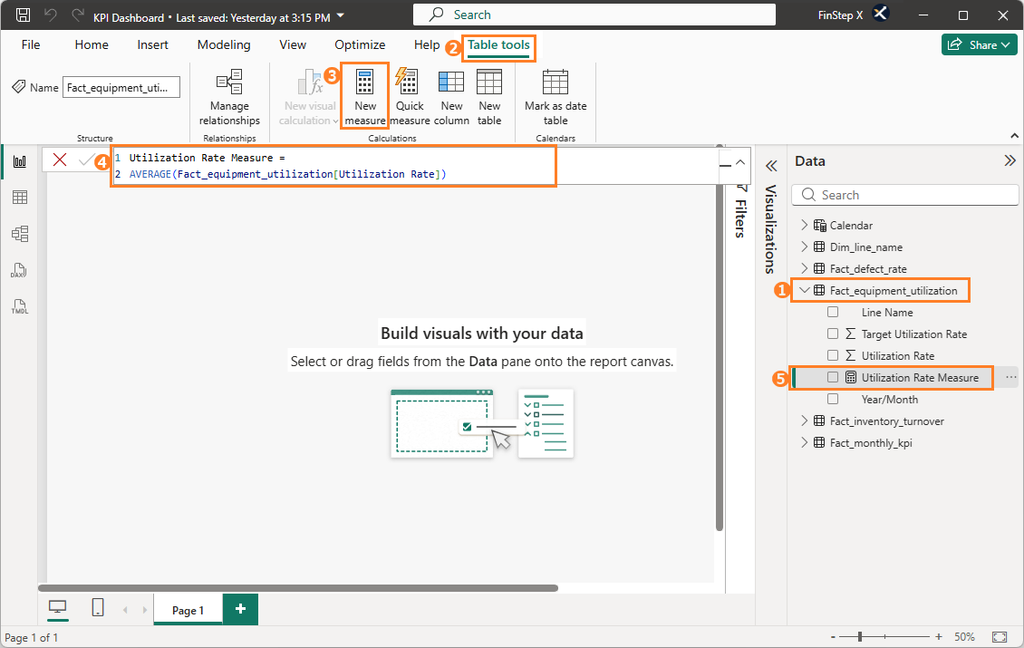
Set the Format of the Utilization Rate Measure to Percentage and set the number of decimal places to 1.
Step 4: Save the File
Once you have finished creating the measures, press Ctrl + S to save the file.
The KPI Dashboard.pbix file created in Vol. 4 now contains the four basic KPI measures.
Summary
In this article, we created four basic KPI measures using DAX.
We also looked at how SUM, AVERAGE, and DIVIDE can be used to calculate these KPIs correctly.
| KPI | Key Functions | Calculation Approach |
|---|---|---|
| Operating Margin | SUM + DIVIDE | Aggregate the underlying amounts before calculating the operating margin |
| Utilization Rate | AVERAGE | Calculate the average utilization rate across rows |
| Inventory Turnover | SUM + DIVIDE | Aggregate COGS and inventory before calculating inventory turnover |
| Defect Rate | SUM + DIVIDE | Aggregate defect quantity and production quantity before calculating the defect rate |
The basic DAX measures needed to display these KPIs on the dashboard are now ready.
Frequently Asked Questions (FAQ)
1. What are the benefits of using DAX?
DAX calculations respond dynamically to filters and slicers in the report.
2. Are DAX’s SUM, AVERAGE, and DIVIDE functions the same as their Excel counterparts?
SUM and AVERAGE work in the similar way as their Excel counterparts.DIVIDE is Power BI specific and is widely used for ratio calculations.
3. What is the difference between DIVIDE and / in Power BI?
DIVIDE provides a safer way to handle division when the denominator is zero. By default, it returns BLANK instead of producing a division-by-zero error.
For ratio calculations, DIVIDE is generally preferred.
4. Why don’t we use “AVERAGE” for all KPIs?
For ratio-based KPIs, they should be calculated by dividing the totals rather than averaging the ratios for each row.
However, for the Utilization Rate in this example, using the average is acceptable because we assume the same available working hours for each product line.
5. Which table should I create DAX measures in?
The calculation result is not affected by which table the measure is stored in.
However, organizing measures consistently makes them easier to manage. In this series, we store each measure in its fact table.
What’s Next?
In Vol. 6, we will use the four measures created in this article to calculate year-over-year (YoY) changes and target achievement using DAX.
These calculations are an important step toward displaying KPI results in Card visuals on the dashboard.