


Financial Insights | Industry KPI Guide Series Vol. 4
The bottom line:
The two KPIs to look at first in retail are Conversion Rate and GMROI (Gross Margin Return on Inventory Investment).
Sales can be broken down as: Store Traffic × Conversion Rate × Average Transaction Value
Even with the same number of visitors, problems with store layout, stockouts, point-of-purchase (POP) displays, or customer service can quickly lead to a decline in Conversion Rate.
But growing sales do not necessarily mean the business is becoming healthier. If sales growth comes at the expense of heavy discounting and lower margins, or if unsold products continue to build up in inventory, the business may actually be getting worse.
GMROI captures the combined outcome of profitability and inventory efficiency in a single metric.
Use Conversion Rate to understand the quality of sales, and GMROI to understand the quality of profit and inventory investment. Looking at these two KPIs together provides a much clearer picture of the health of a store or product category.
Why Sales Can Be Strong While Profit Remains Weak in Retail
In retail, sales being higher than last year does not necessarily mean the business is performing well.
Common warning signs include:
- Lower margins caused by heavy discounting
- Unsold products accumulating as inventory
- Stockouts caused by cutting inventory too aggressively
- An increasing reliance on high-turnover, low-margin products
Looking at sales alone can easily hide these problems. By managing Gross Margin, Inventory Turnover, and GMROI together, retailers can build a more stable business without relying solely on sales volume.
The Retail Lifecycle and Its Key KPIs
Retail operations can be viewed as a continuous flow: Inventory ➜ Traffic ➜ Sales ➜ Profit
These four stages are closely connected rather than independent. When one part of the cycle weakens, the impact tends to spread to the next stage.
Excess inventory / stockouts ➜ Less attractive shopping experience / lower conversion ➜ Greater reliance on discounting / lower margins
KPIs help identify where a problem is occurring and how its impact is flowing through the business.
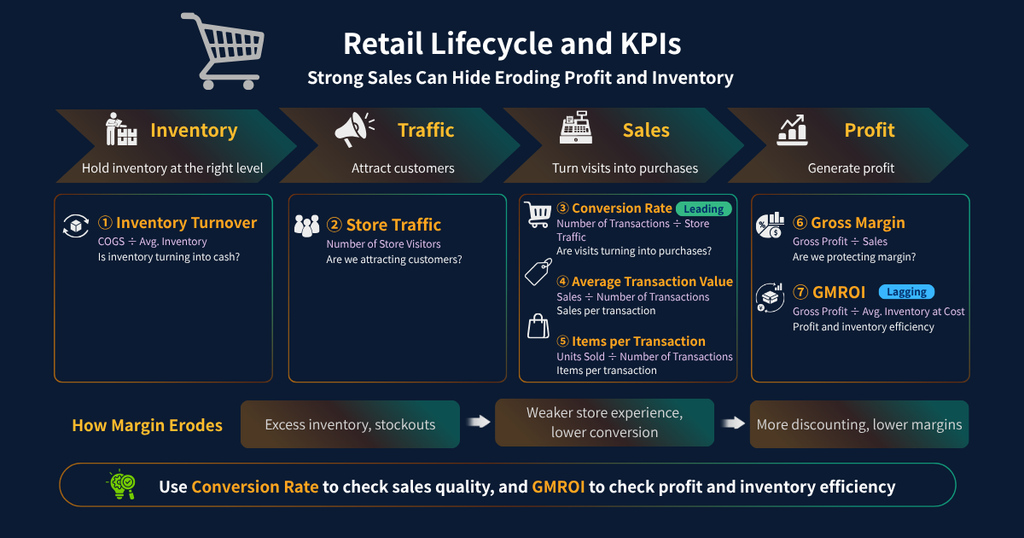
7 Key KPIs for the Retail Industry
| Phase | KPI | Formula | What to Look For* |
|---|---|---|---|
| Inventory | Inventory Turnover | Cost of Goods Sold ÷ Average Inventory | YoY trend and peer comparison |
| Traffic | Store Traffic | Measured by people counters, sensors, etc. | YoY and vs. plan |
| Sales | Conversion Rate | Number of Transactions ÷ Store Traffic | YoY trend and peer comparison |
| Sales | Average Transaction Value | Sales ÷ Number of Transactions | Business-model dependent |
| Sales | Items per Transaction | Units Sold ÷ Number of Transactions | Business-model dependent |
| Profit | Gross Margin | Gross Profit ÷ Sales | YoY trend and peer comparison |
| Profit | GMROI | Gross Profit ÷ Average Inventory at Cost | YoY trend and peer comparison |
① Inventory Turnover | Is Inventory an Asset or Cash Tied Up?
Inventory Turnover = Cost of Goods Sold ÷ Average InventoryInventory creates opportunities to generate sales, but unsold products tie up cash.
A very high turnover rate may indicate a risk of stockouts, while a low turnover rate may indicate excess or slow-moving inventory.
② Store Traffic | The Starting Point for Generating Sales
Sales can be broken down as: Store Traffic × Conversion Rate × Average Transaction Value
That makes store traffic the starting point of the sales process.
A decline may be caused by factors such as new competitors opening nearby, changes in the local customer base, or declining effectiveness of promotional activities.
The goal is not simply to drive traffic through one-off campaigns, but to create a sustainable reason for customers to keep coming back.
③ Conversion Rate | Are You Turning Visits into Purchases?
Conversion Rate = Number of Transactions ÷ Store TrafficWhen store traffic is healthy but sales are not growing, this is one of the first KPIs to check.
Store layout, point-of-purchase (POP) displays, stock availability, and customer service quality can all directly affect conversion.
④ Average Transaction Value | How Much Does Each Customer Spend?
Average Transaction Value = Sales ÷ Number of TransactionsSelling more high-priced products is one way to increase transaction value, but recommending complementary products and offering bundled products can also be effective through upselling and cross-selling.
⑤ Items per Transaction | How Many Items Does Each Customer Buy?
Items per Transaction = Units Sold ÷ Number of TransactionsThis KPI helps determine whether an increase in average transaction value is being driven by higher prices or more items per transaction.
⑥ Gross Margin | A Fundamental Measure of Profitability
Gross Margin = Gross Profit ÷ SalesBecause purchasing costs have a direct impact on profitability, gross margin is one of the most fundamental profitability KPIs in retail.
A decline may be caused by higher purchase costs, excessive discounting, or changes in product mix.
Possible improvements include increasing the share of higher-margin products, reviewing discounting policies, and negotiating better purchasing terms.
⑦ GMROI | Measure Profitability and Inventory Efficiency in One Metric
GMROI = Gross Profit ÷ Average Inventory at CostGMROI (Gross Margin Return on Inventory Investment) measures how efficiently the money invested in inventory generates gross profit.
Looking at margin alone can cause you to overlook a store with strong margins but slow-moving inventory. Looking only at inventory turnover can cause you to overlook a store that sells quickly but generates very little profit. GMROI brings these two perspectives together.
GMROI is generally evaluated on an annual basis. If you calculate it from monthly gross profit, multiply the result by 12 to annualize it before making comparisons.
Warning Signals: Reading Business Risks Through KPI Changes
| KPI | Warning Signal | Business Risks | First Action |
|---|---|---|---|
| Inventory Turnover | Down 20% or more YoY | Growing slow-moving inventory | Check stockouts, identify/dispose of excess inventory |
| Store Traffic | Down 10% or more YoY | Structural decline in customer traffic | Analyze local market and competitors; strengthen promotions |
| Conversion Rate | Declining for 2 consecutive months | Store layout or customer service issues | Review layout, POP displays, and stockouts |
| Average Transaction Value | Down 10% or more YoY | Lower sales per customer | Promote higher-value products |
| Items per Transaction | Below the prior year for 2 consecutive months | Lost cross-selling opportunities | Improve bundling and product placement |
| Gross Margin | Declining YoY for 2 consecutive months | More discounting; rising purchasing costs | Review discounting policies and negotiate with suppliers |
| GMROI | Declining YoY for 2 consecutive months | Lower return on inventory investment | Break down margin and turnover by store and category |
How to Conduct a KPI Review
Step 1: Start with the results
Compare sales and gross margin with the previous year and budget to understand where the month ended.
Step 2: Identify the drivers
Use store traffic, conversion rate, average transaction value, and items per transaction to identify what drove changes in sales.
Step 3: Assess inventory efficiency
Use inventory turnover and GMROI to evaluate the balance between profitability and inventory efficiency.
Step 4: Decide on actions
Turn the findings into specific actions by clarifying who will do what, and by when, across areas such as promotions, product mix, and purchasing plans.
Summary
Retail KPIs are connected through a single flow from inventory to traffic, sales, and profit. Rather than looking at each metric in isolation, it is important to understand how the numbers influence one another.
The seven KPIs covered in this article can be summarized as follows:
| Phase | KPI | Key Points to Check | Business Impact |
|---|---|---|---|
| Inventory | Inventory Turnover | Is inventory moving efficiently? | Cash flow |
| Traffic | Store Traffic | Are we attracting customers from our market area? | Starting point of sales |
| Sales | Conversion Rate | Are visits turning into purchases? | Sales |
| Sales | Average Transaction Value | Is spending per customer growing? | Sales |
| Sales | Items per Transaction | Are cross-selling and upselling working? | Sales |
| Profit | Gross Margin | Is margin being protected? | Profitability |
| Profit | GMROI | Are profitability and inventory efficiency balanced? | Return on inventory investment |
Looking only at sales, a lagging indicator, can cause retailers to miss problems such as declining margins caused by excessive discounting or inventory accumulating because products are not selling.
By monitoring Gross Margin, Inventory Turnover, and GMROI together, retailers can assess the true health of a store from both profitability and inventory-efficiency perspectives.
The goal of retail KPI management is to identify which stores or product categories are achieving both healthy margins and efficient inventory utilization, and then replicate those successful practices across other stores.
Frequently Asked Questions
1. What are the most important KPIs in retail?
Conversion Rate and GMROI.
Conversion Rate is a leading indicator of how effectively a store turns customer traffic into sales. GMROI is a lagging (outcome) indicator of the quality of profitability and inventory efficiency.
2. Is a higher GMROI always better?
Generally, a higher GMROI is better. However, an unusually high figure can also indicate that inventory has been cut too aggressively, increasing the risk of stockouts.
It is important to evaluate GMROI together with Inventory Turnover and stockout rates.
3. What should our target Inventory Turnover be?
It varies significantly by retail format.
A grocery store and an apparel retailer have very different sales cycles, so targets should be established based on your own historical performance and comparisons with similar retailers.
4. What should we check first when Conversion Rate declines?
Start with four areas: 1) Store layout and customer flow, 2) POP displays, 3) Stockouts, 4) Customer service quality.
Conversion Rate is often one of the earliest indicators of problems on the sales floor.
5. Which KPIs are affected by upselling and cross-selling?
Upselling: Encouraging customers to choose a higher-priced product, increasing Average Transaction Value.
Cross-selling: Encouraging customers to purchase complementary products, increasing Items per Transaction.
In short, upselling primarily affects Average Transaction Value, while cross-selling primarily affects Items per Transaction.
Next Article
Financial Insights | Industry KPI Guide Series Vol. 5