


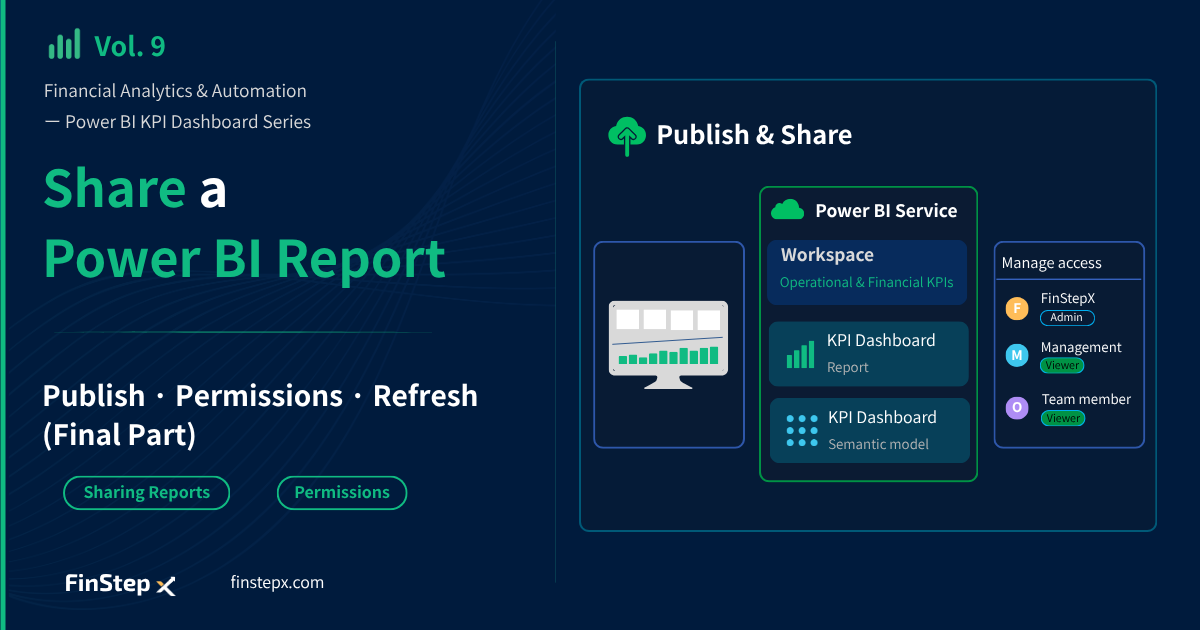
Financial Analytics & Automation / Power BI KPI Dashboard Creation Series (Final Installment)
Introduction
In Vol. 8, we updated the appearance of the report we had built throughout this series. However, the report is still stored only in our local PC, meaning no one else can view it.
In this final installment, we’ll publish the completed report to Power BI Service so that management and team members can access it. We’ll also cover how to refresh the data after publishing and how to manage access permissions for viewers.
What We’ll Cover in This Article
| Step | Contents |
|---|---|
| Step 1 | Sign in to Power BI Service |
| Step 2 | Create a workspace |
| Step 3 | Publish the report from Power BI Desktop |
| Step 4 | Review the published items in Power BI Service |
| Step 5 | Learn how to refresh the data |
| Step 6 | Add users and configure access permissions |
| Step 7 | Run a final checklist before sharing |
Before You Begin
To publish a report to Power BI Service, you’ll need an organizational account (a work or school account). Personal email addresses, such as Gmail and Outlook.com accounts, cannot be used to sign in.
If you don’t have an organizational account, you may be able to set one up through a Microsoft 365 free trial or a similar offering. For current eligibility requirements and sign-up instructions, see the official Microsoft website.
You’ll also need a Power BI Pro or Premium Per User (PPU) license to publish and share reports. In general, people who access shared reports also need a Pro or PPU license. For more information about Power BI Pro licensing, visit the official Microsoft website.
This article assumes that you already have an organizational account and a Power BI Pro license.
Step 1: Sign In to Power BI Service
Open Power BI Service in your browser.
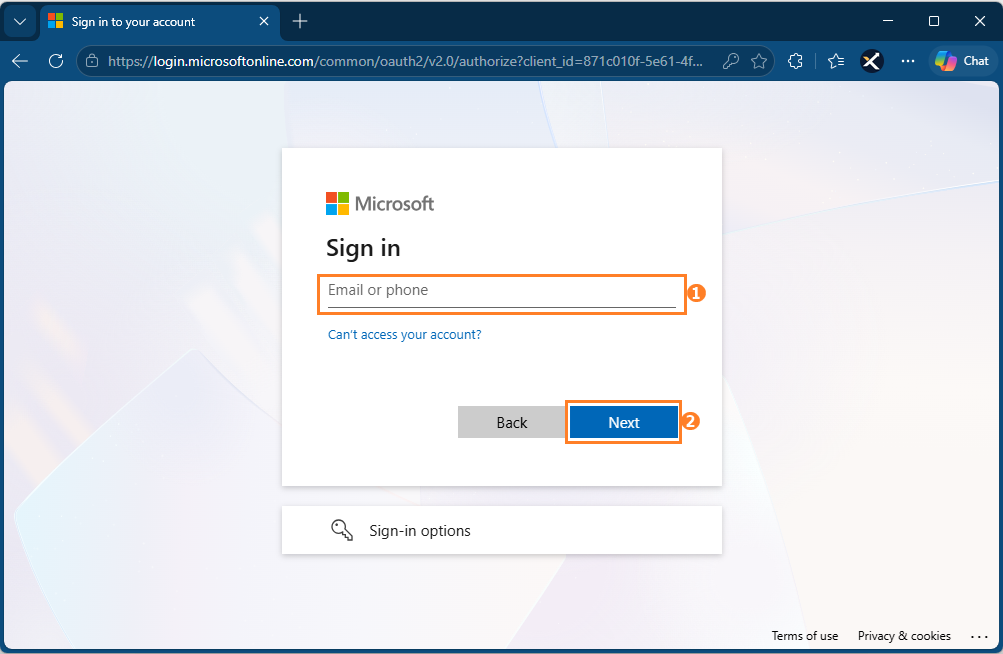
When the Sign in screen appears, enter your organizational email address in the Email or phone field and click Next. On the next screen, enter your password to complete the sign-in process.
Once you’ve signed in, your account icon will appear in the upper-right corner of the screen.
Step 2: Create a Workspace
Power BI Service provides two types of workspaces: My Workspace for your personal use, and a Workspace for team use.
| Workspace | Purpose |
|---|---|
| My Workspace | A personal workspace for individual use. You can use it to review your work or prepare drafts. |
| Workspace | A shared environment where teams or project groups can store, manage, and share reports and data models. |
In this article, we’ll create a new workspace named “Operational & Financial KPIs” to manage and share reports as a team.
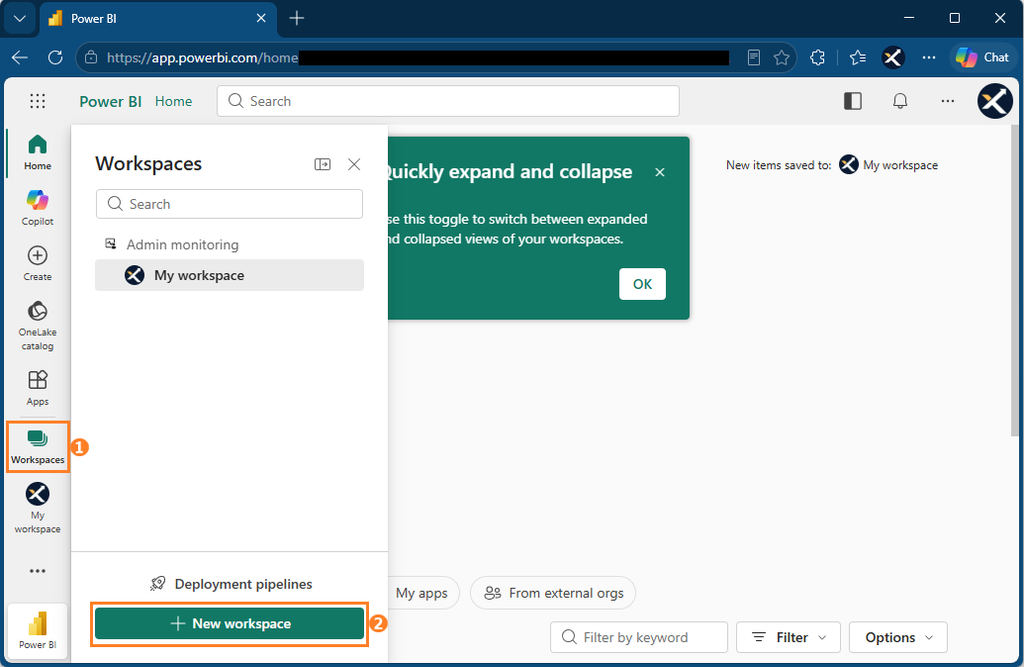
In the left-hand navigation menu of Power BI Service, click Workspaces ➜ + New workspace.
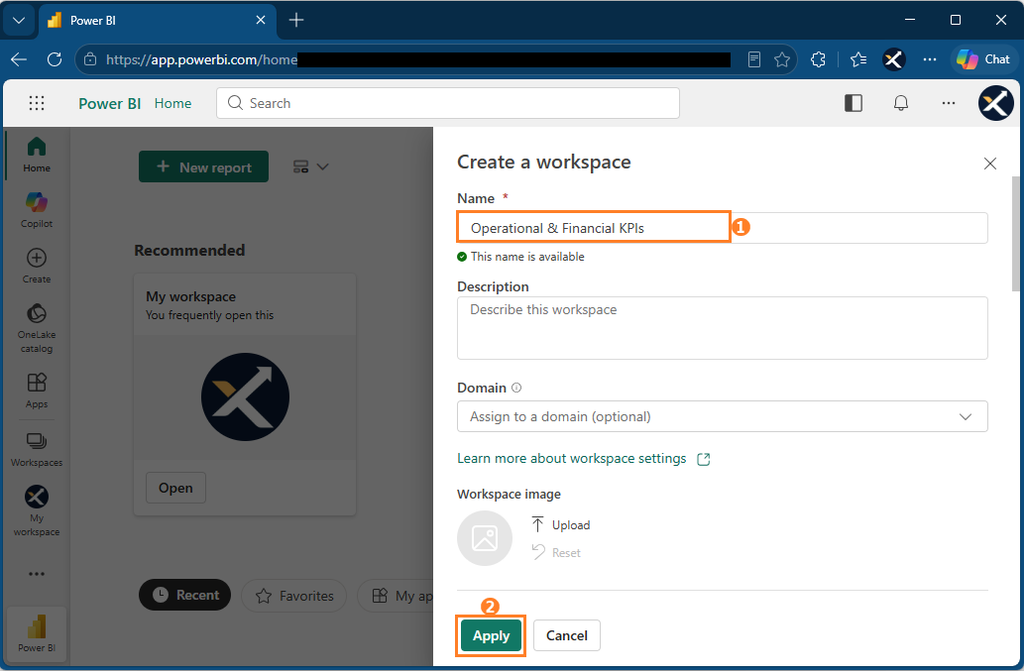
In the Create a Workspace screen, enter “Operational & Financial KPIs” in the Name field, then click Apply.
The Description and Domain fields are optional. We’ll leave them blank for this example.
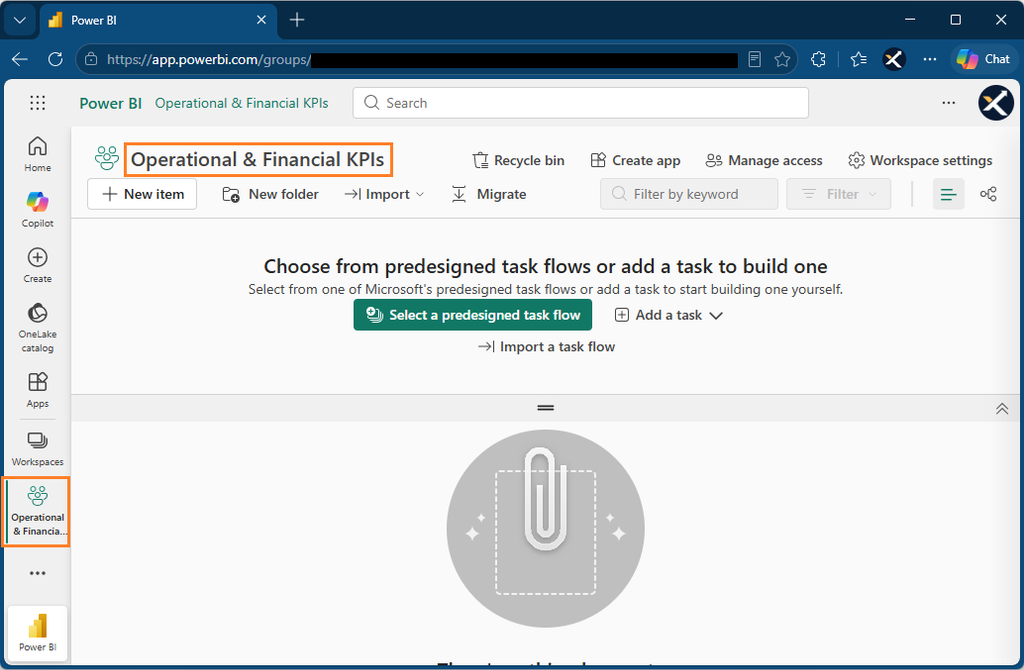
Once the workspace has been created, its empty workspace page will open. The person who creates a workspace automatically becomes its administrator.
Step 3: Publish the Report from Power BI Desktop
Once you’ve created a workspace in the Power BI Service, publish the report from Power BI Desktop.
Open “KPI Dashboard.pbix” file (the dashboard we have created through Vol. 8) in Power BI Desktop. If you haven’t signed in yet, click Sign in in the upper-right corner and sign in with the same organizational account you used for Power BI Service.
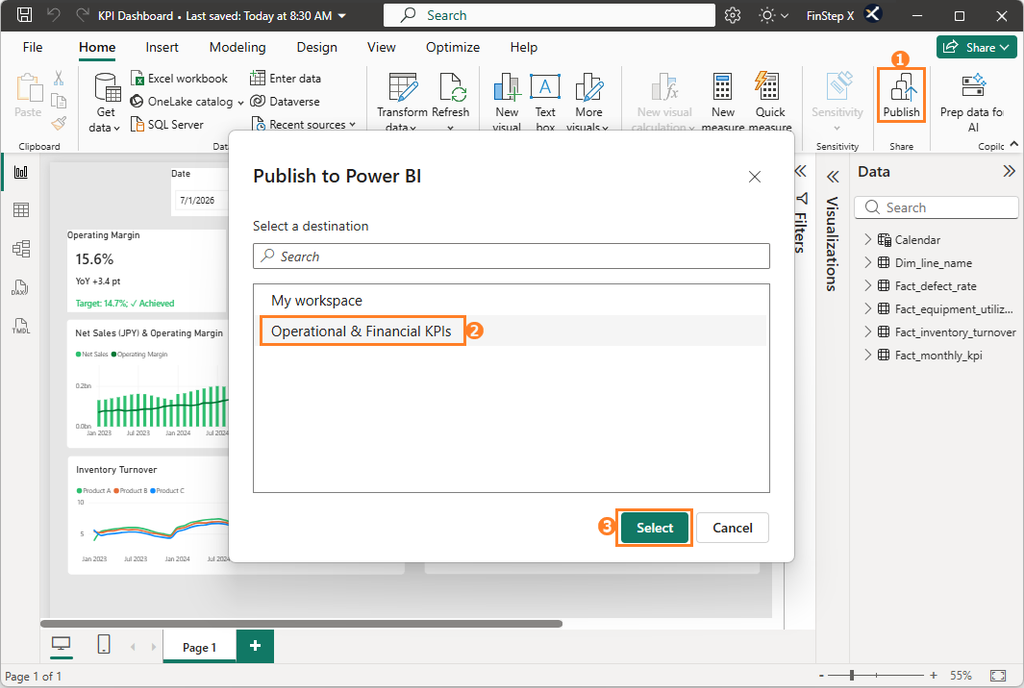
Click the Home tab ➜ Publish. If the file hasn’t been saved, you will be prompted to save it.
On the Publish to Power BI screen, select “Operational & Financial KPIs” (which you created in Step 2), and click Select. If you publish to “My workspace,” you won’t be able to share it with others, so be sure to select “Operational & Financial KPIs.“
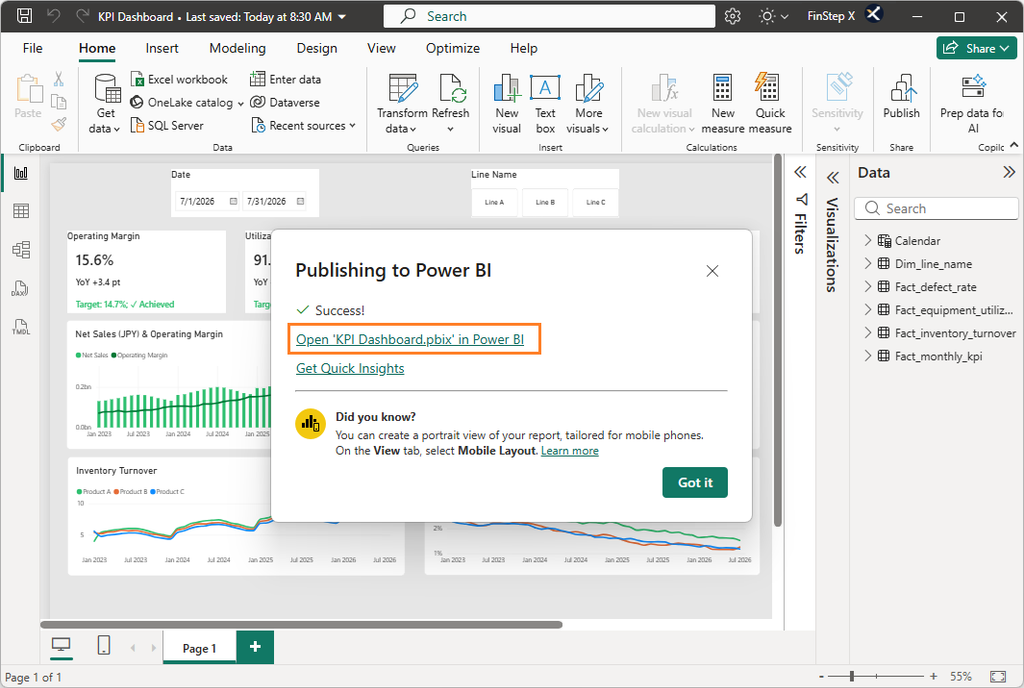
Once Success! message appears on the screen, publishing is complete.
Click Open ‘KPI Dashboard.pbix’ in Power BI to open the report in Power BI Service.
Once the report opens in Power BI Service, interact with the slicers, cards, and charts to confirm that they work as expected, just as they do in Power BI Desktop.
Step 4: Review the Published Items in Power BI Service
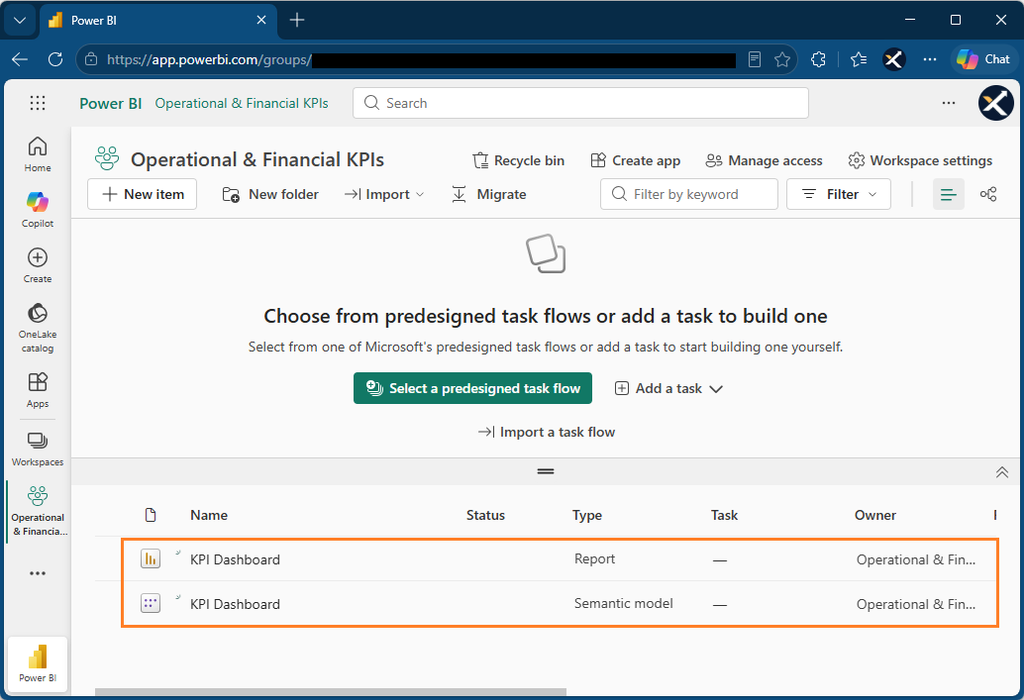
In the left-hand navigation menu of Power BI Service, open Workspaces and select “Operational & Financial KPIs,” which you created in Step 2. The items published to the workspace will appear in the list.
Publishing a report from Power BI Desktop typically creates the following two items. You can identify each item by checking the Type column.
| Type | Contents |
|---|---|
| Report | The report that displays the visuals created in Power BI Desktop, such as cards and charts. This is the item viewers open to see the report. |
| Semantic Model | The underlying model that manages the report’s data, including tables, measures, and relationships between tables. Data refresh settings are also configured here. This item was previously called a “Dataset.” |
Step 5: Learn How to Refresh the Data
When you publish a report from Power BI Desktop, the report and its data at that point in time are saved to Power BI Service. If you subsequently update the source CSV files, the data in Power BI Service is not updated automatically. This is because Power BI Service cannot directly access CSV files on your PC. (It can be updated if you set up an on-premises data gateway, but that is outside the scope of this series.)
In this article, we explain how to republish the report from Power BI Desktop. Follow these steps for the monthly data update:
- Replace the source CSV files with the new data. Do not change the file names or locations. (If you do, the refresh will fail.)
- Open “KPI Dashboard.pbix” in Power BI Desktop and click Refresh on the Home tab.
- Confirm that the data has been updated correctly.
- Change the date slicer to the latest month (for example, 2026/08/01 – 2026/08/31). The slicer selection is also saved in the published report.
- Click Publish on the Home tab.
- Select “Operational & Financial KPIs” as the destination and click Select.
- When the Replace confirmation screen appears, review the contents and replace.
After republishing, the report in Power BI Service is updated. Because you are updating the same report, you can usually continue using the link you previously shared. Whenever you change the design of charts or other elements in Power BI Desktop, republish the report by following steps 5 to 7.
Step 6: Add Users and Configure Access Permissions
To share a report with other people, you need to grant them access. When adding users to a workspace, you assign each person a role that determines what they can do.
The four main workspace roles are:
| Role | Main Uses |
|---|---|
| Viewer | View reports |
| Contributor | Create and edit content, including reports |
| Member | Manage content and share it with others, along with other permissions |
| Admin | Manage the entire workspace |
For users who only view reports, the Viewer role is sufficient. As a general rule, you should not grant more permissions than necessary.
In this example, we’ll assign the Viewer role to a user named Test.
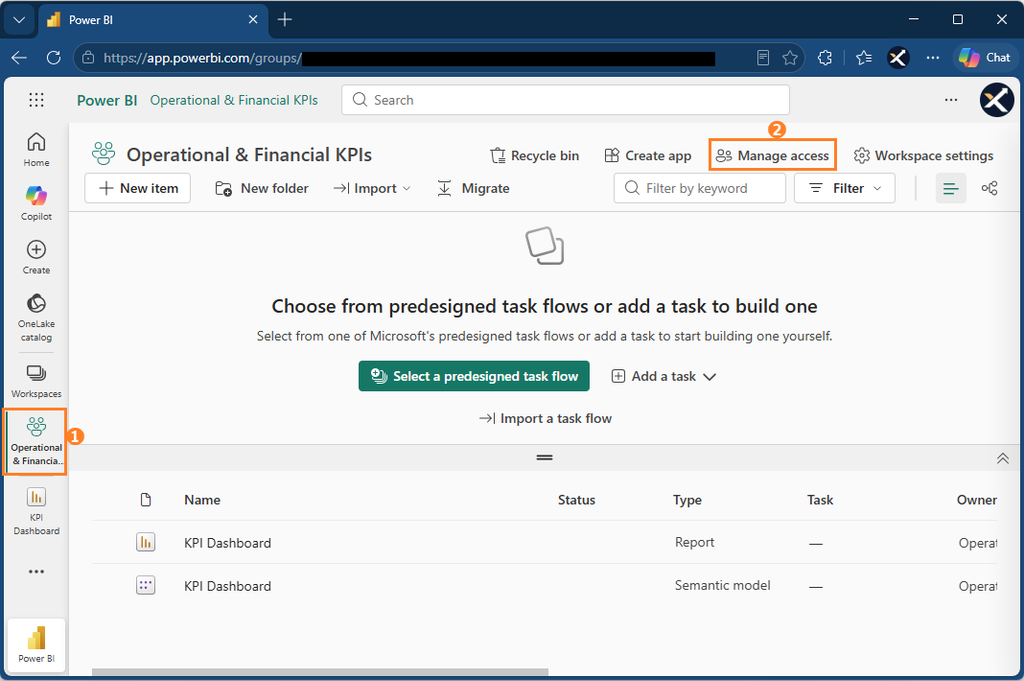
Open the “Operational & Financial KPIs” workspace you created in the Power BI Service, and click Manage access.
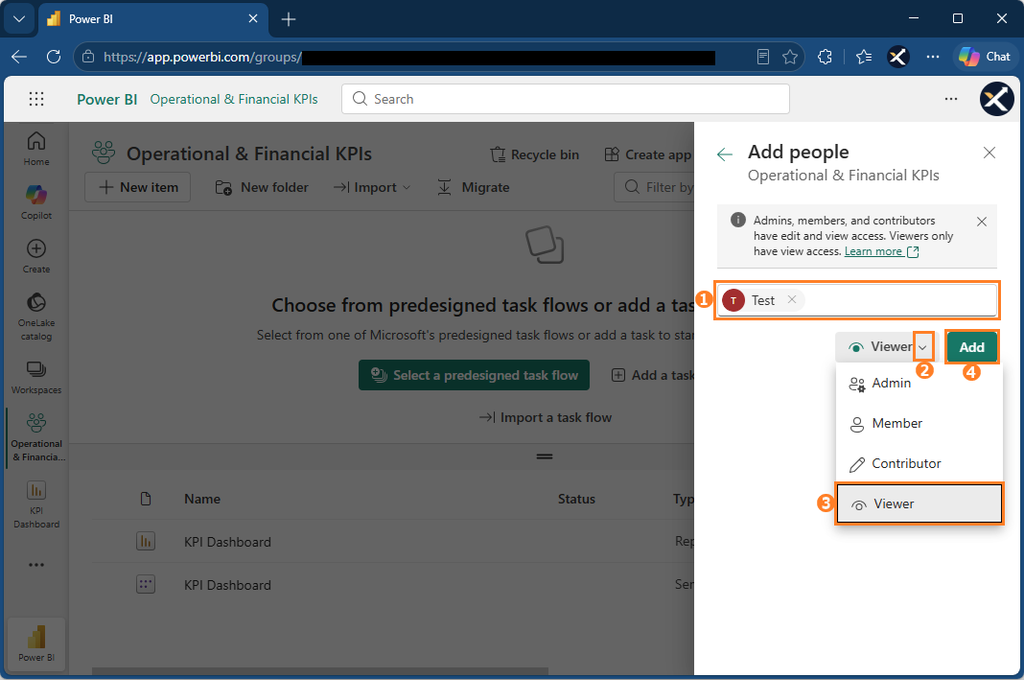
The Add People screen will open. Enter the name or email address of the user you want to add, select Viewer from the role drop-down menu, and click Add.
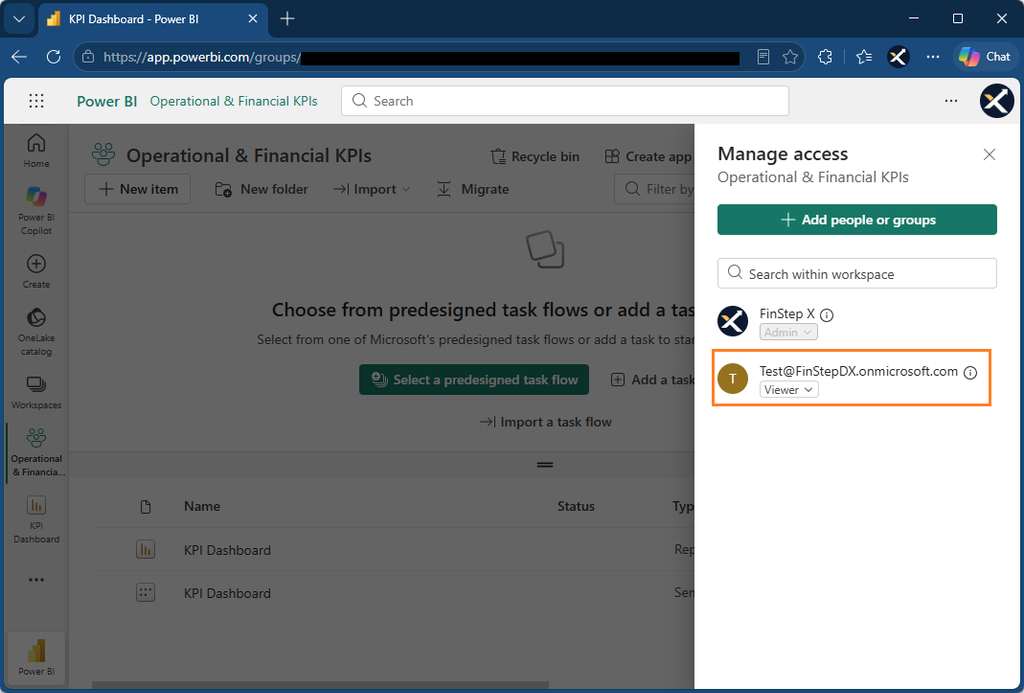
After the user has been added, their name and assigned role will appear in the Manage access list.
Step 7: Run a Final Checklist Before Sharing
Before distributing the report, open it using a different account (or a colleague’s account) with the Viewer role and check the following items.
If you only check it using the Admin account, you may not notice any permission-related issues.
| Items to Check | How to Check |
|---|---|
| The latest month’s KPIs are displayed when the report is opened | The date slicer is set to the latest month (for example, 2026/07/01 – 2026/07/31) |
| The date slicer allows users to change the reporting period. | Change the date range and confirm that the values displayed on the cards update accordingly. |
| The Line Name slicer affects the cards and charts. | Switch between Line A, B, and C and confirm that the displayed results change. |
| The cards display the current values, YoY comparisons, and target achievement status correctly. | Check the achievement labels (such as “Achieved” (✓)) and their colors correctly displayed on the four cards. |
| All three charts continue to display the full date range when the date slicer is adjusted. | Check the Net Sales & Operating Margin, Inventory Turnover, and Defect Rate charts. |
| The latest month’s data is included. | Confirm that the rightmost point on each relevant chart represents the latest month. |
| Viewers cannot edit the report. | Sign in with a Viewer account and confirm that editing options are unavailable. |
| Only authorized users can access the report. | Check the Manage access list to ensure that only the intended users have been added. |
| The KPI values are correct. | Compare the results with Power BI Desktop and confirm that sales, operating margin, inventory turnover, and other KPIs display the expected values. |
Once you’ve completed these checks, add the intended viewers to the workspace by following Step 6.
With the report open, copy its URL from your browser’s address bar and share it with the intended users via chat or email.
Anyone who has not been granted access to the workspace will not be able to open the report, even if they receive the link.
Summary
Throughout this nine-part series, we’ve covered the entire process, from importing CSV files to sharing a completed report. Thank you for following along.
Here’s a recap of what we’ve covered:
- Preview the completed Power BI Dashboard (Vol. 1)
- Install Power BI Desktop (Vol. 2)
- Import five CSV files using Power Query (Vol. 3)
- Create a Calendar table and establish relationships using a star schema (Vol. 4)
- Create KPI measures using SUM, AVERAGE, and DIVIDE (Vol. 5)
- Calculate YoY comparisons and target achievement status using DAX (Vol. 6)
- Add slicers, cards, and charts to the report (Vol. 7)
- Format the Power BI Dashboard (Vol. 8)
- Publish the report to Power BI Service, configure access permissions, and share it with others (Vol. 9)
Once you’ve built a Power BI report, your monthly routine will be replacing the source data, refreshing it, republishing the report, and checking the results.
Questions such as “How much did we sell this month?”, “How does performance compare with the same period last year?”, and “Are we meeting our targets?” can be answered simply by selecting the appropriate filters in the report, without having to recalculate everything in Excel.
The time saved can be redirected toward more valuable management activities, such as investigating why profit margins have declined or analyzing budget-versus-actual variances.
Try following the same process with your own company’s data and KPIs.
Frequently Asked Questions (FAQ)
1. What licenses are required to share a report?
Usually, both the publisher and the viewers need a Power BI Pro or PPU license.
If the workspace is assigned to Premium or Fabric capacity, users with a free license may also be able to view the report. For details, please check with your organization’s Power BI administrator.
2. I’ve shared the report, but the recipient cannot open it. What should I check?
Check the following:
1. Has the recipient been assigned a role in the workspace?
2. Does the recipient have the required Power BI license?
3. Is the recipient signed in with the correct organizational account?
If the problem persists, contact your organization’s Power BI administrator.
3. Can I change permissions later?
Yes. From “Manage access” in the workspace, you can change a user’s role or remove their access.
4. What happens to the shared report when I edit it in Power BI Desktop?
Changes made in Power BI Desktop are not reflected in the report in Power BI Service until you republish it.
Republishing the report after your edits to update the report in Power BI Service.
5. I’ve replaced the CSV files, but the report in Power BI Service still shows the old data. Why?
The correct refresh procedure depends on where your CSV files are stored and how Power BI connects to them.
If you’re using CSV files stored on your local PC, as in this series, you need to refresh the data in Power BI Desktop and republish the report to update the version in Power BI Service.