



Financial Insights | Industry KPI Guide Series Vol. 2
The bottom line:
The two KPIs to look at first in manufacturing are OEE (Overall Equipment Effectiveness) and CCC (Cash Conversion Cycle).
Material waste, equipment downtime, and rising defect rates on the shop floor all drive up costs. However, it can take weeks or even months before the impact shows up in the financial statements.
OEE gives you an early view of operational losses before they show up in the financial results. By tracking it daily or weekly, you can spot warning signs before financial performance starts to deteriorate.
CCC, on the other hand, shows how far operational issues are affecting cash and working capital.
In other words, use OEE to identify early signs of trouble and CCC to understand the impact on cash. Tracking both gives management a better chance to act before problems appear in the financial results.
Why Problems Can Go Unnoticed Until It Is Too Late
Compared with many other industries, manufacturing has two distinctive characteristics: high fixed costs and significant inventory requirements.
- Manufacturing companies typically make large investments in factories and equipment. Fixed costs such as depreciation and labor costs are difficult to reduce quickly, even when sales decline.
- Inventory is an asset that supports future sales, but it also ties up cash and can put pressure on working capital.
Material waste, equipment downtime, defective products, overtime, and slow-moving inventory may each seem like relatively small issues. But when they accumulate, they can have a significant impact on profitability and cash flow.
By the time the impact shows up in the financial results, it may already be too late to respond effectively. That is why manufacturers need to monitor operational KPIs on a regular basis, rather than looking only at revenue and profit.
The Manufacturing Lifecycle and How KPIs Connect
Manufacturing businesses typically repeat a cycle of Orders ➜ Production ➜ Cost Management ➜ Inventory & Collection.
These stages are not independent. Problems in one stage can quickly spread to the next.
For example, defects and equipment downtime can lead to rework, higher work-in-process inventory, and delivery delays. This can increase production costs while also causing inventory to build up and putting pressure on cash.
Equipment downtime, defects, and material waste ➜ Higher costs and lower profitability ➜ Inventory buildup and cash pressure
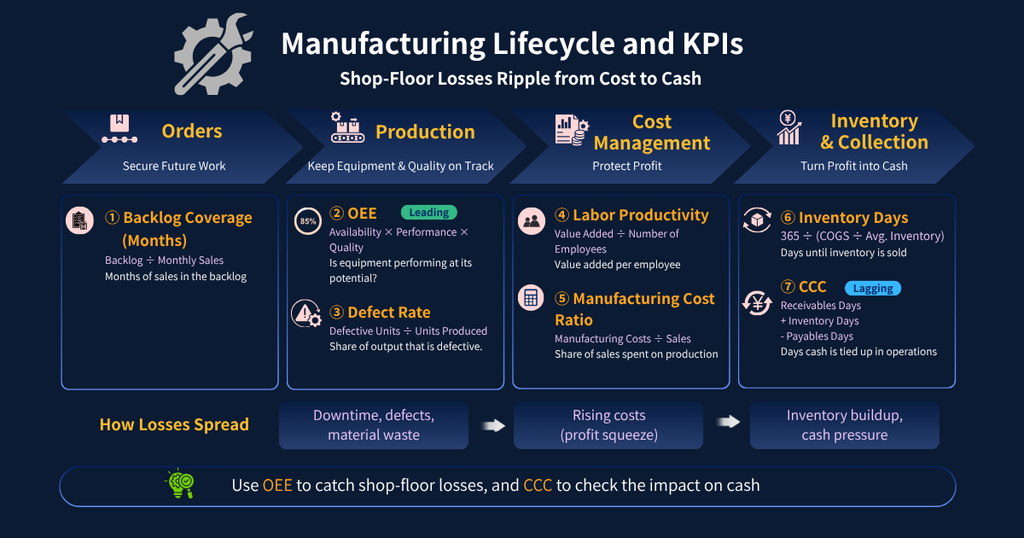
7 Key KPIs for the Manufacturing Industry
| Phase | KPI | Formula | What to Look For* |
|---|---|---|---|
| Orders | Backlog Coverage (Months) | Backlog ÷ Monthly Sales | Months of sales covered by the backlog |
| Production | OEE | Availability × Performance × Quality | Trend within your own business; 85%+ is often cited as world-class |
| Production | Defect Rate | Defective Units ÷ Units Produced | Trends by process and product |
| Cost Management | Labor Productivity | Value Added ÷ Number of Employees | YoY trend and peer comparison |
| Cost Management | Manufacturing Cost Ratio | Manufacturing Costs ÷ Sales | YoY trend and peer comparison |
| Inventory & Collection | Inventory Days | 365 ÷ (Cost of Goods Sold ÷ Average Inventory) | YoY trend and trends by product |
| Inventory & Collection | CCC | Receivables Days + Inventory Days − Payables Days | Trend over time and comparison with your historical average |
① Backlog Coverage (Months) | Do You Have Enough Future Business?
Backlog Coverage (Months) = Backlog ÷ Monthly SalesSales tell you what has already happened. Backlog, particularly for make-to-order manufacturers, provides a forward-looking view of future revenue.
A sustained decline in backlog can be an early warning sign of lower sales in the months ahead.
② OEE | Are Your Equipment and Production Lines Performing at Their Full Potential?
OEE = Availability × Performance × Quality

Availability = Actual Operating Time ÷ Planned Production Time
Performance = Ideal Cycle Time × Total Units Produced ÷ Actual Operating Time
Quality = Good Units ÷ Total Units Produced
OEE (Overall Equipment Effectiveness) measures how effectively equipment is being used relative to its potential.
Breaking OEE down into its three components helps identify where the major losses are occurring: equipment downtime, reduced operating speed, or quality problems.
③ Defect Rate | How Are Quality Problems Affecting Costs?
Defect Rate = Defective Units ÷ Units ProducedDefective products increase not only material and processing costs, but also the time required for inspection, rework, and other corrective activities.
If defects are discovered after shipment, additional costs may arise from returns, warranty claims, and customer support.
A rising defect rate can be an early warning sign of deterioration in the manufacturing cost ratio, making early intervention important.
④ Labor Productivity | Are You Using Your Workforce Efficiently?
Labor Productivity = Value Added ÷ Number of Employees
Value Added = Sales − External Costs such as Materials and Outsourced Services
Simply increasing headcount does not necessarily improve profitability.
Labor productivity should be monitored continuously, particularly through year-over-year trends and comparisons with industry peers.
⑤ Manufacturing Cost Ratio | Are Manufacturing Costs Under Control?
Manufacturing Cost Ratio = Manufacturing Costs ÷ SalesBreaking the ratio down into its components can make the underlying improvement opportunities much easier to identify.
- Higher material cost ratio: Rising raw material prices or an increase in defective products
- Higher labor cost ratio: More overtime or inefficient use of labor
- Higher manufacturing overhead ratio: A higher allocation of fixed costs due to lower production volumes
⑥ Inventory Days | Is Cash Sitting in Inventory?
Inventory Days = 365 ÷ (Cost of Goods Sold ÷ Average Inventory)The longer inventory remains on hand, the longer cash is tied up in inventory.
This is one of the reasons a company can be profitable on paper while still struggling with cash flow.
⑦ CCC | How Efficiently Is Working Capital Turning Over?
CCC = Receivables Days + Inventory Days − Payables Days

Receivables Days = 365 ÷ (Sales ÷ Average Accounts Receivable)
Payables Days = 365 ÷ (Cost of Goods Sold ÷ Average Accounts Payable)
CCC (Cash Conversion Cycle) measures how long it takes to convert cash invested in the operating cycle back into cash collected from customers.
A shorter CCC generally means the business can operate with less working capital tied up in its operations.
There are three main ways to improve CCC:
- Reduce inventory
- Shorten customer payment terms or improve collections
- Review supplier payment terms
Warning Signals: Reading Business Risks Through KPI Changes
| KPI | Warning Signal | Business Risks | First Action |
|---|---|---|---|
| Backlog Coverage (Months) | Declining for 3 consecutive months | Future revenue decline | Strengthen sales activities and analyze the pipeline |
| OEE | Below 70% | Difficulty recovering equipment investment | Break OEE into availability, performance, and quality to identify the root cause |
| Defect rate | Rising for 2 consecutive months | Higher manufacturing costs | Identify where defects occur by process |
| Labor Productivity | Declining for 2 consecutive quarters | Lower profitability | Separate the impact of value added and headcount, also review OEE and defect rate |
| Manufacturing Cost Ratio | Rising for 2 consecutive months | Pressure on profit margins | Break down cost components and identify the main drivers |
| Inventory Days | More than 20% above the prior year | Excess inventory and lower cash efficiency | Review inventory by product |
| CCC | More than 30 days above the historical average | Working capital shortage | Reduce inventory, strengthen receivables management, and consult your bank if needed |
How to Conduct a KPI Review
Step 1: Start with the results
Review revenue, gross margin, and operating profit against the previous month and the same month last year.
Step 2: Identify the drivers
Work backward through the manufacturing lifecycle and drill down into operational KPIs such as OEE and defect rate.
Step 3: Look ahead
Use backlog coverage, inventory days, and CCC to identify potential risks in the coming months.
Step 4: Decide on actions
Clearly define who will do what, and by when.
Summary
Manufacturing KPIs are designed to measure and manage the different stages of a single operating cycle, from orders through production and cost management to inventory and cash collection.
If you focus only on results such as revenue and profit margins, you can easily miss structural problems on the shop floor, such as equipment losses or excess inventory.
When a KPI shows an abnormal change, work backward through the cycle to identify where the problem originated. This is a practical way to use KPIs for management.
Here is a summary of the seven KPIs covered in this article:
| Phase | KPI | Key Points to Check | Management Impact |
|---|---|---|---|
| Orders | Backlog Coverage (Months) | Is enough future business secured? | Future revenue |
| Production | OEE | Is equipment performing at its potential? | Production volume and cost ratio |
| Production | Defect Rate | Are quality problems increasing? | Cost ratio and profit margin |
| Cost Management | Labor Productivity | Is the workforce used efficiently? | Profitability |
| Cost Management | Manufacturing Cost Ratio | Are manufacturing costs under control? | Gross margin |
| Inventory & Collection | Inventory Days | Is inventory moving efficiently? | Cash flow |
| Inventory & Collection | CCC | Is working capital being used efficiently? | Cash efficiency |
The purpose of KPI management in manufacturing is to understand how operational losses flow through to costs and cash—and to take action before those problems show up in the financial results.
Frequently Asked Questions
1. What are the most important KPIs in manufacturing?
OEE and CCC are two of the most important KPIs to monitor.
OEE is an early indicator of operational losses, while CCC shows how those operational and working-capital issues are ultimately affecting cash.
2. Why should management and finance teams monitor operational KPIs?
Financial statements primarily show what has already happened. Operational KPIs provide earlier signals of changes that may affect future financial performance.
3. What should our OEE target be?
An OEE of 85% or higher is often cited as a world-class benchmark.
However, the appropriate target depends on the equipment, production process, and operating environment. The most important thing is to consistently track your own trend over time.
4. What happens when inventory days increase?
More cash becomes tied up in inventory, which can weaken cash flow.
Slow-moving inventory also increases the risk of markdowns, obsolescence, and disposal.
5. How often should manufacturing KPIs be reviewed?
OEE and defect rate are typically worth reviewing daily or weekly, while inventory days and CCC are generally more appropriate for monthly reviews.
Regular monitoring makes it possible to address issues before they become visible in the financial statements.
Next Article
Financial Insights | Industry KPI Guide Series Vol. 3
Construction KPIs: 7 Key Metrics, Starting with SPI and Construction Receivable Days