


Financial Analytics & Automation / Power BI KPI Dashboard Creation Series
Introduction
In Vol.1, we introduced the overall concept of a Power BI dashboard and showed what the completed dashboard would look like.
Power BI can streamline repetitive monthly tasks such as data preparation and report creation, giving finance and management teams more time to analyze business performance and support management decision-making.
In this article, we will install Power BI Desktop and become familiar with the main areas of the interface that you will frequently use when creating reports, the first step in building our financial KPI dashboard.
Key Power BI Tools and Services
When you start exploring Power BI, you may come across similar terms such as Power BI Desktop, Power BI Service, and Power BI Pro. This series uses the following three.
| Name | Purpose |
|---|---|
| Power BI Desktop | A Windows application used to import and transform data, build data models, and create reports |
| Power BI Service | A cloud service used to publish and share reports, refresh data, and manage access |
| Power BI Pro | A paid license required to publish and share reports in Power BI Service workspaces |
The basic workflow is:
Create a report in Power BI Desktop ➜ Publish it to Power BI Service ➜ Share it as needed using Power BI licensing such as Power BI Pro
In this series, we will use Power BI Desktop to build our report (KPI dashboard) through Vol.8. In the final article Vol.9, we will cover how to use Power BI Service to publish and share the completed report.
Installing Power BI Desktop
There are two main ways to get Power BI Desktop.
1. Microsoft Store version (Recommended)
Search for “Power BI Desktop” in the Microsoft Store and click “Get” or “Install”.
The Microsoft Store version is updated automatically, so you will always have the latest version.
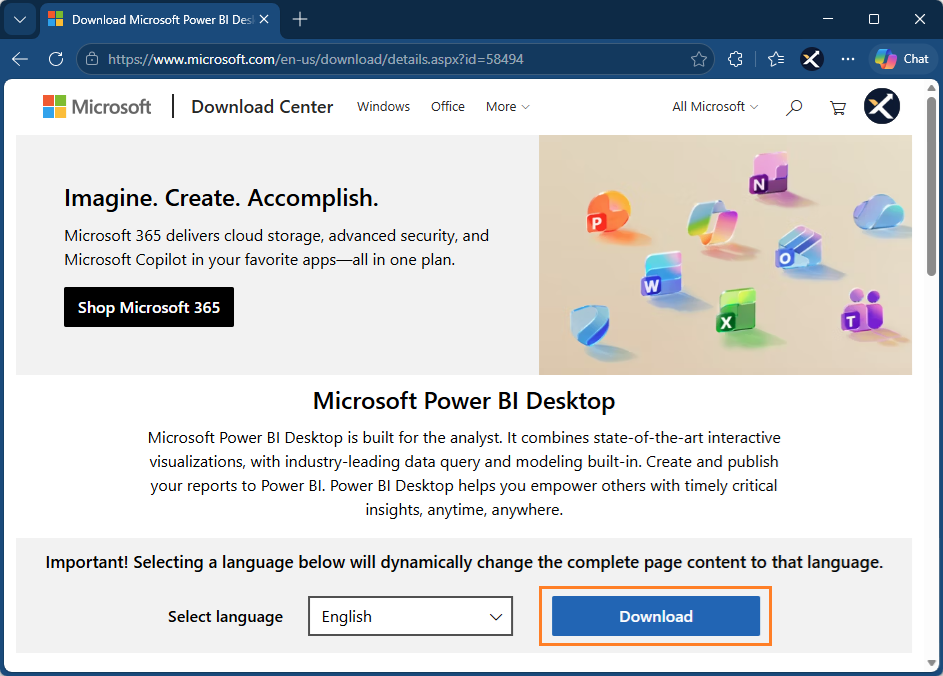
2. Download the installer directly from Microsoft’s official website
If you cannot use the Microsoft Store, you can download the installer directly from Microsoft’s official website.
Microsoft Official Website: Download Microsoft Power BI Desktop
After downloading the installer, run it and follow the on-screen instructions to complete the installation.
Launching Power BI Desktop and Creating a Blank Report
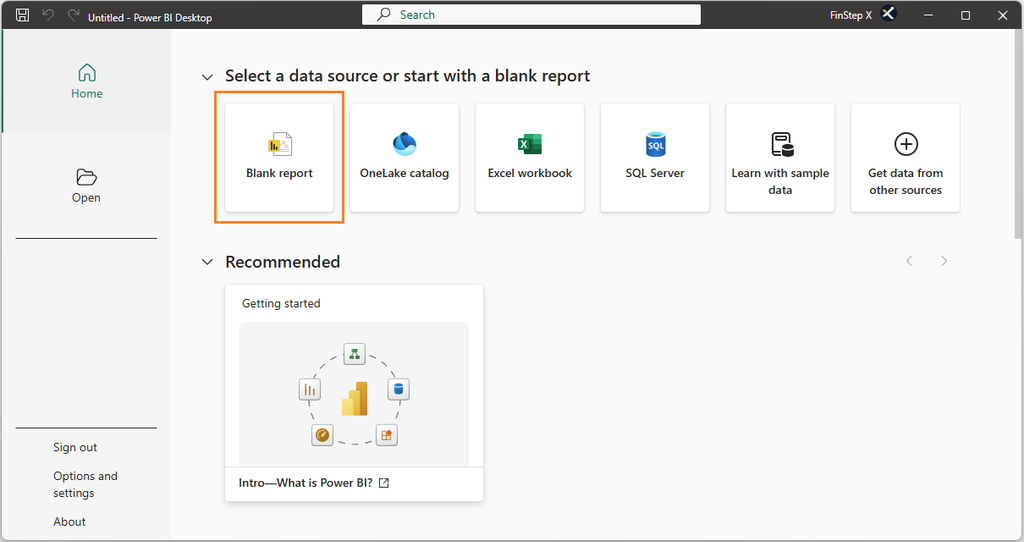
When you launch Power BI Desktop, the start screen will appear.
Click “Blank report” to open the report authoring interface. You may be prompted to sign in with a Microsoft account. However, this is not needed if you only create a report in Power BI Desktop.
Power BI Desktop Interface
Power BI Desktop provides the tools you need to import, transform, analyze, and visualize data and create reports.
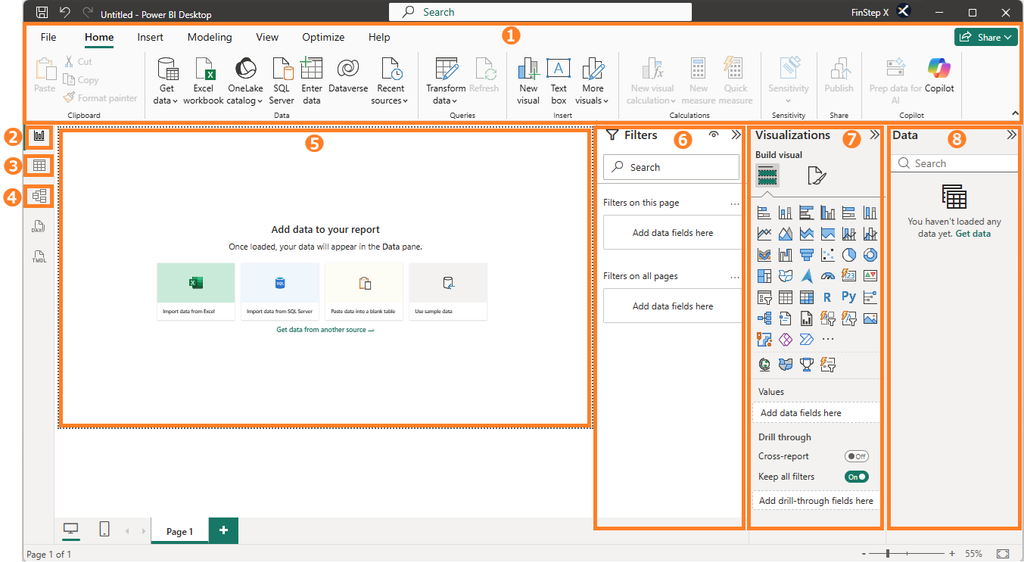
For beginners, there are eight key areas of the interface that are worth knowing.
❶ Ribbon
The Ribbon is the menu area at the top of the screen.
It includes tabs such as “Home”, “Insert”, “Modeling”, and “View”. Many of the main Power BI operations—including getting data, adding visuals, and creating DAX measures—can be accessed from the Ribbon.
You can open Power Query by clicking “Transform data” on the “Home” tab.
❷ Report View
Report View is one of the view icons on the left side of the screen.
This is where you create report pages and add visuals such as cards and charts. The KPI dashboard we build throughout this series will primarily be created in this view.
❸ Table View
Table View displays the data loaded into Power BI in a tabular format.
Use it to check the contents of the data and the data type of each column (such as number, date, or text).
❹ Model View
Model View is where you view and configure relationships between tables.
In Vol.4, we will take a closer look at the Calendar table and its relationships.
❺ Report Canvas
The Report Canvas is the main area where you build your report when working in Report View.
This is where you place visuals such as KPI cards, charts, and slicers to create your dashboard.
❻ Filters Pane
The Filters pane is used to filter the data displayed in your report.
You can set the scope of a filter, such as page level or the entire report.
❼ Visualizations Pane
The Visualizations pane is used to select and configure visuals.
You can choose visual types such as cards, tables, and charts, and configure the data, formatting, and other settings for each visual.
❽ Data Pane
The Data pane displays the tables and columns (fields) that have been loaded into Power BI.
You can select fields from this pane and add them to your visuals.
Summary
In this article, we covered how to install Power BI Desktop and reviewed the key areas of the interface used when creating reports.
| Area / Feature | Main Purpose |
|---|---|
| Ribbon | Access key functions such as getting data, adding visuals, and creating DAX |
| Report View | Create and edit report pages |
| Table View | Examine loaded data in a table format |
| Model View | View and configure relationships between tables |
| Report Canvas | Place and arrange visuals |
| Filters Pane | Configure filters to narrow down the data |
| Visualizations Pane | Select and configure visual types |
| Data Pane | View loaded tables and columns |
Starting with the next article, we will begin building our KPI report using sample manufacturing data.
Frequently Asked Questions (FAQ)
1. Can I use Power BI Desktop on a Mac?
Power BI Desktop is a Windows application.
If you use a Mac, you will need to run Windows through a supported environment, such as a virtual machine or another Windows environment.
2. Do I need a Microsoft account?
You do not need a Microsoft account to sign in to Power BI Desktop if you only import data and create reports.
However, a work or school account is required for online services such as publishing and sharing reports through Power BI Service. Personal accounts such as Gmail and Outlook.com cannot be used for this purpose.
3. Can I use Power BI Desktop without an internet connection?
Yes. If you are working with data stored locally on your computer, many basic Power BI Desktop tasks can be performed offline.
However, an internet connection is required for activities such as publishing and sharing reports through Power BI Service and connecting to online data sources.
4. Can I change the display language in Power BI Desktop?
Yes. You can change the display language in Power BI Desktop.
For example, take the following steps to switch the Language to “Japanese”:
1. Click “File” at the top of Power BI Desktop.
2. Select “Options and settings” → “Options”.
3. Under Regional Settings, select “Japanese” for Application language.
4. Restart Power BI Desktop.
5. What should I do if I cannot install it on my company PC?
This is often due to company policy restrictions, so please consult your IT department.
If you cannot use the Microsoft Store, you can download and install Power BI Desktop using the installer from the official Microsoft website.
What’s Next?
In Vol.3, we will use Power Query to import sample manufacturing CSV data and prepare the data that will serve as the foundation for our KPI calculations.