


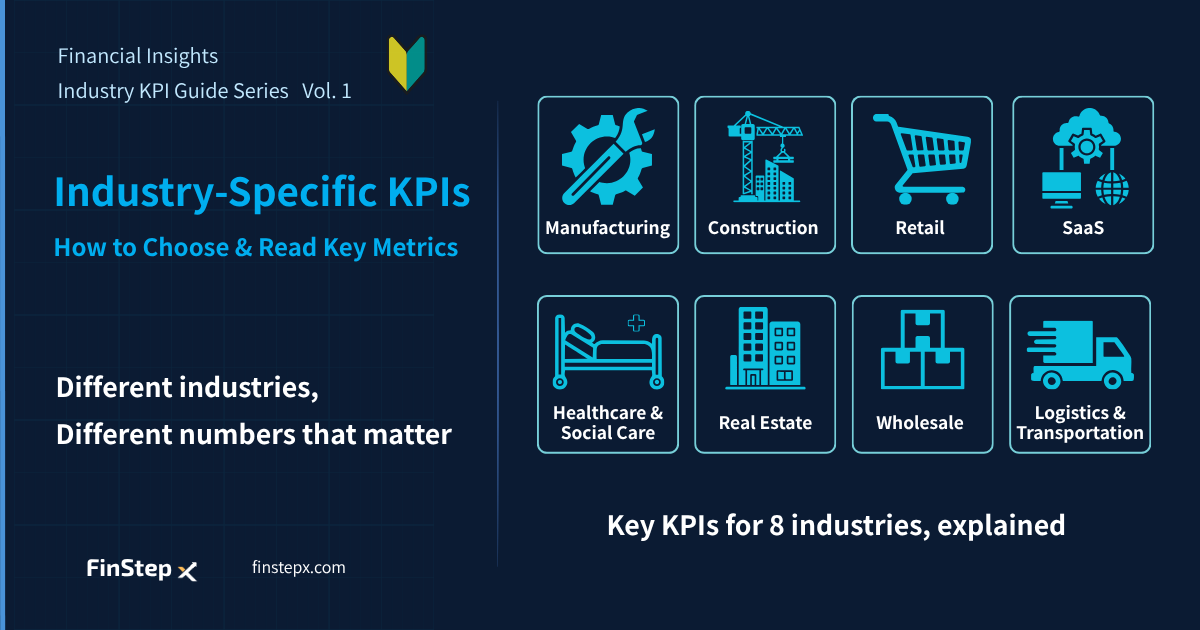
Financial Insights | Industry KPI Guide Series Vol. 1
About This Series
Financial statements do not always tell you the full story of how a business is performing. Revenue and profit show the results of a business, but they do not necessarily tell you what is driving those results.
This series explores the business drivers behind financial results by looking at key performance indicators (KPIs) across eight industries: manufacturing, construction, retail, SaaS, healthcare and social care, real estate, wholesale, and logistics and transportation.
The series consists of 10 articles in total:
- Vol. 1: This introductory article, covering the fundamentals of KPIs
- Vol. 2–9: Eight articles focusing on each industry
- Final article: A comprehensive review of the series
In this first article, we will start with the basics: what KPIs are, why they differ by industry, and how to read them effectively.
What Is a KPI?
KPI stands for Key Performance Indicator.
Every business has ultimate goals, such as increasing revenue, generating profit, or creating long-term value. These ultimate goals are often referred to as Key Goal Indicators (KGIs).
KPIs are the metrics used to monitor whether the business is moving in the right direction toward those goals. In other words, KPIs help you understand the current state of a business through numbers.
KPIs include more than just measures of past performance. They also include early signals and efficiency measures, which we cover in three type of KPIs below.
- Lagging indicators, which show results that have already occurred
- Leading indicators, which provide early signals of what may happen next
- Efficiency indicators, which show how effectively resources are being converted into results
Revenue and profit can serve as KGIs at the company level, while the same measures may be used as KPIs at the department or business-unit level. In either case, they are lagging indicators because they reflect results that have already occurred.
The KPIs You Need to Watch Depend on the Industry
Even when looking at the same metric, such as revenue, the numbers that matter most to management can vary significantly from one industry to another because business models are different.
In manufacturing, for example, management needs to pay close attention to whether inventory is building up and whether production equipment is being used effectively. Metrics such as inventory days and Overall Equipment Effectiveness (OEE) can therefore be highly important.
For a SaaS company, on the other hand, equipment utilization is far less relevant. A metric such as churn rate, which shows how many customers are leaving, can have a much greater impact on the business.
Different business models require different metrics. The KPIs management prioritizes can also change depending on a company’s strategy and stage of growth.
The table below provides a starting point for the key metrics to review in each industry. The idea is to combine leading indicators, which help identify changes early, with lagging indicators, which show the resulting impact.
KPIs to Watch by Industry
| Industry | Business Model | Key Management Focus | Leading Indicator ➜ Lagging Indicator |
|---|---|---|---|
| Manufacturing | Purchase raw materials, process them, and sell finished products | Production efficiency, inventory optimization, and asset utilization | OEE ➜ CCC |
| Construction | Long-term, project-based business model | Project profitability management | SPI ➜ Construction Receivables Days |
| Retail | Purchase and resell products | Inventory turnover and store productivity | Conversion Rate ➜ GMROI |
| SaaS | Recurring revenue through subscriptions | Customer retention and growth | Churn Rate ➜ NRR |
| Healthcare & Social Care | Reimbursement-based model | Capacity utilization and workforce productivity | Bed Occupancy Rate ➜ Labor Cost Ratio |
| Real Estate | Rental income model | Asset utilization and operating performance | Occupancy Rate ➜ NOI |
| Wholesale | Intermediary distribution business | Working capital and cash conversion | Slow-Moving Inventory Ratio / Overdue Receivables Ratio ➜ CCC |
| Logistics & Transportation | Transportation services using vehicles and personnel | Fleet utilization and profitability | Vehicle Utilization ➜ Operating Cost Ratio |
Three Types of KPIs
There are many different types of KPIs, but in practice, it is useful to organize them into three broad categories.
1. Lagging Indicators
These metrics show results that have already occurred, such as revenue, operating profit, and ROE.
They are essential for measuring business performance. However, by the time a problem appears in a lagging indicator, it may already be too late to take effective action.
Lagging indicators also tell you what happened, but not necessarily why it happened.
2. Leading Indicators
Leading indicators provide clues about future performance.
Examples include backlog, the number of customer inquiries, and customer satisfaction.
If a leading indicator deteriorates, it may signal that revenue or profit could come under pressure in the following month or quarter.
3. Efficiency Indicators
Efficiency metrics show how effectively a company converts its resources into results.
Examples include inventory turnover, asset turnover, and labor productivity.
If two companies generate the same level of revenue but one does so with fewer assets or lower costs, that company can be considered more efficient.
Three Things to Look for When Reading KPIs
1. Focus on Trends, Not Just Absolute Values
A revenue figure of ¥100 million does not tell you much on its own.
It is important to compare the figure with the previous month, the same period last year, or the budget to understand which direction the business is moving in.
2. Compare with Industry Benchmarks
A gross margin of 30% can mean very different things depending on the industry.
For example, it may be considered relatively high for a supermarket business, while it could be considered low for a SaaS company.
Financial metrics should therefore not be viewed in isolation. They need to be interpreted in comparison with industry benchmarks and competitors.
3. Read Multiple KPIs Together
Looking at a single KPI can lead to misleading conclusions.
For example, revenue may be growing while inventory is building up and receivables are taking longer to collect. In such a situation, the underlying quality of the business may actually be deteriorating.
The key is to look at related KPIs together rather than evaluating each metric in isolation.
How to Read the Industry Articles
Each industry article begins with the bottom line, highlighting the first metrics you should look at.
The articles then follow this structure:
- Why the industry’s underlying numbers can be difficult to interpret
- How the industry lifecycle connects to its KPIs
- Key industry-specific KPIs
- Warning signals to watch for
- How to conduct a KPI review
- Summary
- Frequently Asked Questions
The KPIs covered in each article combine leading indicators, which capture changes in the business early; efficiency metrics, which show how effectively resources are being used; lagging indicators, which reflect business outcomes; and other critical metrics that deserve attention in that particular industry.
The metrics to check first are highlighted at the beginning of each article under “The bottom line”.
You can start with the article covering your own industry and immediately apply the concepts to your business. Reading the other industry articles may also reveal some unexpected similarities across different business models.
Summary
KPIs are more than just numbers. They are tools for understanding whether a business is moving toward its goals and what may be driving its performance.
The KPIs that matter most can vary significantly from one industry to another.
For example, OEE and CCC are important in manufacturing, conversion rate and GMROI in retail, and churn rate and NRR in SaaS. The right KPIs depend on the underlying business model.
Effective KPI analysis requires several perspectives:
- Look at changes over time, such as year-over-year (YoY) and budget variances
- Compare performance with industry benchmarks and competitors
- Analyze multiple related KPIs together
If you want to understand what is really happening inside a business — beyond what can be seen in its financial statements — start by understanding the key KPIs for its industry.
Frequently Asked Questions
1. What is a KPI?
A KPI is a metric used to measure whether a business is making progress toward its goals.
2. What is the difference between a KPI and a KGI?
A KGI represents an ultimate business goal, such as revenue or operating profit.
A KPI measures the progress and drivers that contribute to achieving that goal.
3. Why are KPIs different across industries?
Because business models and revenue structures differ.
Production efficiency may be critical in manufacturing, while customer retention and churn may be much more important for a SaaS company.
4. How should KPIs be analyzed?
Rather than looking at individual numbers in isolation, compare them with the same period last year, the budget, and industry benchmarks. It is also important to analyze multiple related KPIs together.
5. What is the difference between financial analysis and KPI analysis?
Financial analysis focuses primarily on understanding business results, while KPI analysis looks more closely at the drivers and processes behind those results.
Combining the two provides a more complete picture of how a business is actually performing.
Next Article
Financial Insights | Industry KPI Guide Series Vol. 2
Manufacturing KPIs: 7 Key Metrics, Starting with OEE and CCC