


CASE STUDY
Bridging Finance and Operations
Where USCPA Expertise Meets Practical Implementation
Explore the impact of finance transformation
through model cases, ROI analysis, and sample data.
▼ 5+ days
Reduction in Monthly Closing
▼ 80%
Reduction in manual work
Approx. ¥9.8M
Annual PL Improvement(Estimate)
10-Month
ROI Payback Period(Estimate))
※ This simulation is based on sample data.。
Actual results may vary depending on the company.
Case Study Overview
A consulting firm with annual revenue of ¥800 million (2 partners / 20 consultants).
This case assumes a typical situation where rapid growth causes management costs to surface all at once.
A surge in projects and headcount pushes project cost management to its limits.
Each partner manages separate Excel files, making it impossible to see overall profitability.
Management meetings focus solely on reviewing “past numbers,” leaving no room for strategic decision‑making.
- Data formats differ across departments, preventing a unified view
- Excel files are bloated and person‑dependent
- Monthly closing is delayed, causing decisions to lag behind
- KPIs are undefined, leading to misaligned discussions
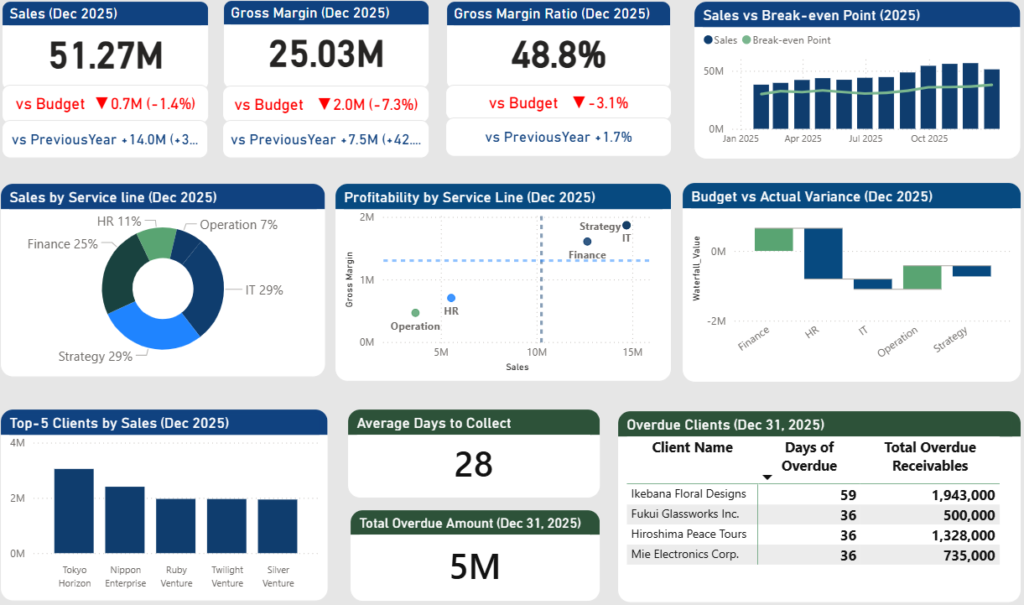
Dynamic Power BI Dashboard for Faster Executive Decision‑Making
- Visualizes profit structure and cash‑collection status using key management KPIs from a USCPA perspective
- Drill‑down structure enables instant analysis of “Why did profit increase or decrease?”
- Real‑time visibility into cash flow, profit margins, and profitability by service line
- Eliminates the need to consolidate multiple Excel reports, dramatically improving meeting efficiency
※This dashboard is a demonstration based on FinStepX’s management dashboard development case and does not use actual data.
Four Steps to Implement the Improvement Model
Identify why the numbers are not visible
- Review existing Excel-based management
- Visualize the revenue structure
- Identify key points for data analysis
Clarify why financial visibility is lacking
Integrate data and establish accurate figures
- Standardize data formats
- Automate data processing and aggregation
- Standardize processes previously dependent on individuals
Monthly workload is significantly reduced, and data reliability improves
Build dashboards that support management decision-making
- Visualize profitability and utilization on a single screen
- Enable drill‑down for deeper analysis
- Make budget vs. actuals and break-even points real‑time
Create an environment where “the next move” can be decided on the spot
Establish a self-sustaining operational structure
- Create manuals
- Train responsible staff
- Systemize monthly review routines
Ensure the organization continues improving independently after implementation
Before vs. After
FinStepX bridges the gap between finance and IT, transforming recurring operational friction into a scalable management system.
ROI (Return on Investment) Simulation
※ These estimates are based on a model case. Actual results vary depending on business scale and data structure.
Approx. ¥1.8M per year
- Reduced workload: 30 hours per month
- Assumed labor cost: ¥5,000 per hour
- Annual savings: Approx. ¥1.8M
- Payback period for initial investment (¥1.5M): Approx. 10 months
Approx. ¥8M per year
- Improvement metric: Gross profit margin
- Assumed impact: 1% increase in margin
- ¥800M annual revenue × 1% = ¥8M per year
ROI Summary
- Operational efficiency ROI: Approx. ¥1.8M per year
- Strategic decision‑making ROI: Approx. ¥8M per year
- Total annual improvement: Approx. ¥9.8M per year
- Payback period: Within 10 months
Mid‑ to Long‑Term Impact
Short Term (0–1 year)
Efficiency gains recover the initial investment. Monthly workloads are significantly reduced, allowing staff to focus on core responsibilities.
Medium Term (1–3 years)
Profit improvements accumulate (approx. ¥10M per year). Data‑driven decision‑making becomes embedded in management processes.
Long Term (3+ years)
Approx. ¥30M in cumulative improvement over three years. Early detection of at‑risk business areas strengthens the overall management structure.
Free ROI simulation for your company
Estimate the potential business impact based on your current workflows and systems — no confidential data required.
※ The simulation is based on general inputs such as number of employees and time currently spent on financial tasks.
- Potential cost savings
- Operational efficiency gains
- Estimated payback period
Pilot Program
- 25% discount for early partner companies
- Direct support from a USCPA
- Support for building a scalable financial management foundation
※ Limited spots available.